Charticulator in Power BI #9
Charticulator Expressions.
In this post we take a break from designing charts and instead take a detailed look at the expressions used by Charticulator when you bind data to an attribute. I’m talking about this type of thing:-
I’m also going to attempt to explain Charticulator’s rather unusual numeric formatting method where you edit characters inside those curly brackets. It’s a syntax known as “d3-format“. Have you ever heard of it? No? Well, neither had I nor indeed have any of my more “techie” friends. It doesn’t help that Charticulator doesn’t throw much light on how you’re meant to use this syntax (it took me quite some time to find out how to insert a comma separator). Just to fill you in, “d3format” is used by JavaScript programmers to format numbers, apparently for “human consumption” (according to GitHub) and is based on Python 3’s formatting specifications. I don’t suppose knowing this really helps a lot. Therefore in what follows is what information I’ve been able to scrape together and what I so far understand.
All Charticulator’s expressions are introduced by the dollar ($) sign. This is synonymous with the equals (=) sign in DAX or Excel. But what is different from DAX or Excel formulas is that in Charticulator part of the expression can include the format specifier. Also a field is referenced without a qualifying table name.
Understanding these aspects of the Charticulator expression means that we can focus on these three separate elements:-
- Referencing a field name
- The aggregation of the data
- The format of the resulting values
Referencing Field Names
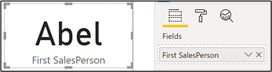
When you want to reference a field in Charticulator, you can simply use the field name. However, if the field name has spaces in it, you must surround the field name with grave a character. The grave character is situated top left of your keyboard, to the left of “1” and under “Esc”.
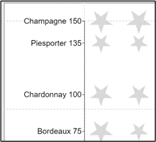
|
Binding a categorical field to the “Text” attribute of a Text mark |
|
|
Image
|
Image
Image
|
You can concatenate field names in a Text mark by using the plus (+) symbol
|
Image
|
Image
|
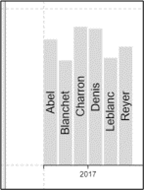
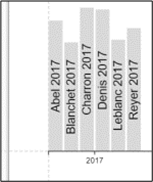
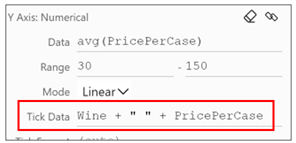
Using Field Names on a Numeric Axis
You may remember that in my last blog post, we looked at using “Tick Data” on a numeric axis where you reference a field name that will label the axis. This is one occasion where you need to type the expression into the attribute. So for instance, below we’ve concatenated the Wine field and the PricePerCase field, separated by a space. Notice that you don’t need any aggregating function because the aggregation is already being expressed in the “Data” attribute:-
|
In the Tick Data attribute you reference the field name. |
|
|
Image
|
Image
|
Using Charticulator’s Aggregate Functions
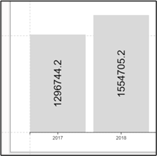
Just like Power BI measures, Charticulator supports functions that return scalar values such as “sum”, “avg”, “max”, “min”, “count”, “stdev”, “variance”, “median”, “first”, “last”. When you first bind a numeric field to an attribute, Charticulator will use the “avg” function by default. For instance, we’ve bound the Sales field to the “Height” attribute of a rectangle shape.
|
Using this data… |
…and binding Sales to the “Height” |
|
|
Image

|
Image
|
Image
|
This is because, unless you use the “Group by..” attribute, each shape represents a single row from the underlying data. Therefore expressing the average of one value is that value (as indeed would using “sum”, “max”, “min”, “first” or “last”). In this case, there is no advantage to changing the function. The exception to this is when you group your data using “Group by…”
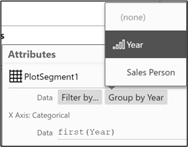
Grouping Data
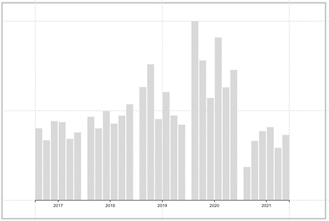
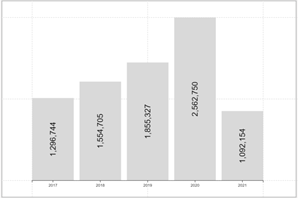
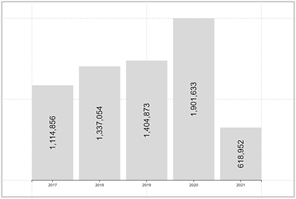
If you are using the “Group by…” attribute of the plot segment then you can edit the function according to what calculation you want to plot. For instance below, we’ve grouped by the Year field and then changed the function used by the “Height” attribute to “min”.
|
You can group the data…. |
….and change the aggregating function |
||
|
Image
|
|
|
Image
|
Image
|
||
|
Image
|
Image
|
||
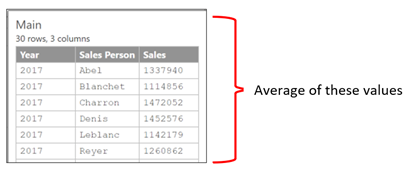
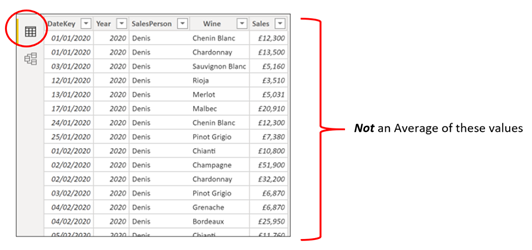
To thing to note here is that these are aggregations of the data behind the visual, not aggregations of the source data:-
|
Image
|
|
Image
|
In upcoming blog posts, I’ll show you how you can use the “Group by…” attribute to great effect in your chart designs.
In the grouping example above where we changed the function to “min”, notice that the Text mark has also been edited to reflect the function being used by the “Height” attribute.
Expressions using Categorical Data
Let’s start with the text expression that is used when you bind a categorical field to an attribute. For instance, we’ve added the SalesPerson field to the “Fill” attribute of a rectangle mark. When using categorical data Charticulator uses the “first” function by default.

You can compare this behaviour to what happens when you use a text column in a Card visual in Power BI:-
Charticulator must use a function to retrieve the text value. As we already know unless we’re grouping the data, the glyph will represent one single row from the underlying data so “first” or “last” will work.
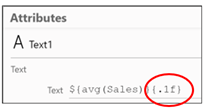
Formatting Numeric Expressions
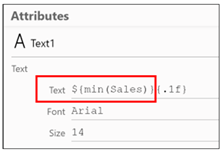
When you bind numeric data to a Text mark Charticulator will apply a default numeric format using one fixed decimal place, indicated by the format string inside the curly brackets:-
|
Image
|
Image
|
Charticulator uses a numeric formatting syntax based on the “d3-format” specification used by JavaScript. You may never have heard of “d3-format” but have you ever created custom Excel formats? If so, you’ll be familiar with the idea of placing format identifiers in specific positions (e.g. positive ; negative ; zero ; text) to determine the format of a number. Well d3-format is a bit like that, only a bit more complicated. Here are the d3-format identifiers:-
[[fill]align][sign][symbol][0][width][,][.precision][~][type]
You can find more information regarding this syntax here https://github.com/d3/d3-format. But for the moment I’m just going to concentrate on what we need to know to format our numeric data in Charticulator.
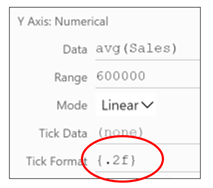
Specify Number of Decimal Places
So for instance, if we take the format specifier in the “Text” attribute circled above i.e. “.1f” , this translates as :-
[[fill]align][sign][symbol][0][width][,][.precision][~][type]
Where
[type] = “f” for fixed decimal. You can find the other “types” in the documentation on GitHub.
[.precision] = “.1” for 1 decimal place.
So this is the expression for 0 decimal places:-
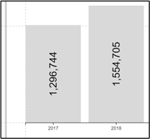
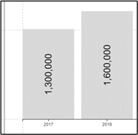
Add a Comma Separator
If you need a comma separator and for instance zero decimal places this would be the format:-
[[fill]align][sign][symbol][0][width][,][.precision][~][type]
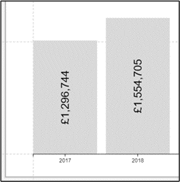
Using Currency Format
For this, just type the currency symbol at the start of the expression.
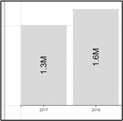
Use M or K
If you want to format using M for millions or K for thousands use the type “s” like this:-
Rounding to Significant Digits
Use the type “r”.
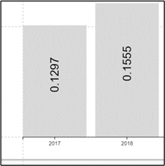
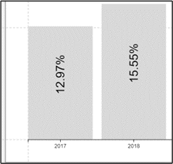
Format as Percent
To format as percent and multiply the value by 100, use the type “%”.

|
Image
|
Image
|
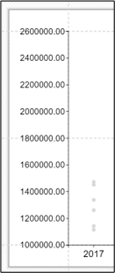
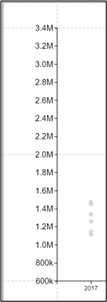
Formatting Numeric Axes Tick Labels
You can use any of the above format specifiers to format a numeric axis. Use the “Tick Format” attribute and type the required format into the attribute. Here are some examples:-
|
Image
|
Image
|
Image
|
Image
|
||
|
Image
|
Image
|
||||
I appreciate that all of this has been a bit dry. Nevertheless it’s very frustrating if you don’t know how to format your data so at least now you won’t have that problem.
I know that you’re itching to get back to creating charts. However, In order to move forward with more challenging charts, we need to get to grips with the rather odd world of Charticulator’s Scales and Legends, which are the subject of my next post. I know we’ve already been using Legends and we’ve touched on the workings of the Scales pane but like always with Charticulator, there’s still a lot more to say. I don’t think you’ll find that very surprising.
Add new comment