It’s Complicated – Dealing with Many-to-Many Relationships in Power BI

If you’re building a DataModel in Power BI, and creating relationships between tables you may have come upon this message.

What the heck does “Cardinality Many-Many” mean? And what is the “Significantly different behaviour” they’re warning me about here? In this post I set out to find out what these Many-to-Many relationships mean and how they work. The answer is complicated, but worth understanding if you want to create efficient data models in Power BI.
Two Types of Many-to-Many Relationship
Let’s start with the first complication; in Power BI data modelling, there are two types of “Many-to-Many” relationships. The first type I’m going to call “Conventional” Many-to-Many relationships, and the second type (which has only been available recently) I’ll call “Cardinal” Many-to-Many relationships. Please note that these are my terms and in no way technical descriptions.
The second complication is that Fact Tables and Dimension Tables can swop their “roles” for the evalution of specific measures whereby Facts become Dimensions and vice versa. And this in itself creates may other complications.
Conventional Many-to-Many
Let’s start with the “Conventional” Many-to-Many. The requirement for this type of relationship is where you need to relate a dimension table to another dimension (as opposed to relating a dimension to a fact table).
So an example of this problem might be as follows:-
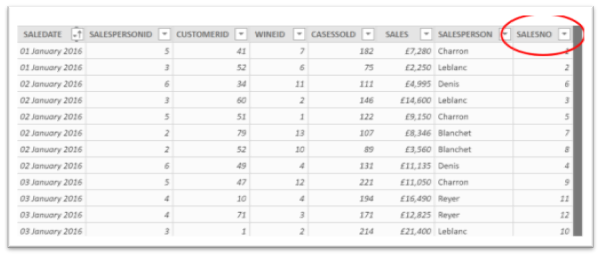
I have a Sales Table that records each sale with a unique identifier, SALESNO:-
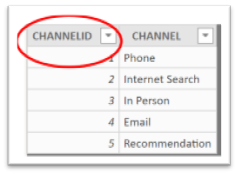
Each sale was achieved through a combination of any of five Sales Channels in the Channels Table, identified by a CHANNELID:-
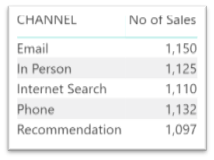
I would like to find out how many sales I’ve made through each channel as in this example:-
The problem is that each sale can be related to many channels and each channel can be related to many sales. How can I relate each sale to its sales channels when I have unique identifiers in both tables? Also note that because I’m interested in EACH sale, my Sales table has changed its “role” from Fact Table to a Dimension. So in other words, how can I relate one dimenstion to another dimension?
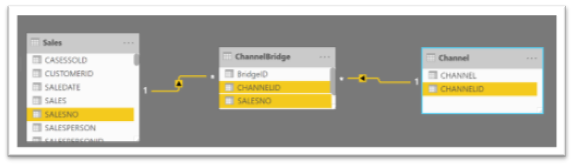
The solution is to create what is called a “Bridge Table” or sometimes a “Factless Fact Table” that records each sale against the channels for that sale, as in this example:-
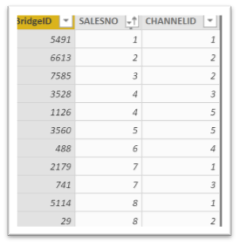
Using this Bridge Table, you can then relate the two dimension tables together via the Bridge Table, whereby the “trail” from Channel to Sales is One-to-Many / Many-to-One:-
The measure for the No of Sales would then be as follows:-
No of Sales = CALCULATE (
COUNTROWS (Sales) ,
CROSSFILTER ( Sales[SALESNO] , ChannelBridge[SALESNO], Both ) )
Explanation
The CROSSFILTER function is required to change the direction of the filter propagation between ChannelBridge and Sales whereby when we filter each Channel in the visual, that filter propogates to the ChannelBridge table and then onwards to the Sales Table.
So that’s the explanation of the “Conventional” Many-to-Many. Now lets’ look at the “Cardinal” Many-to-Many
Cardinal Many-to-Many
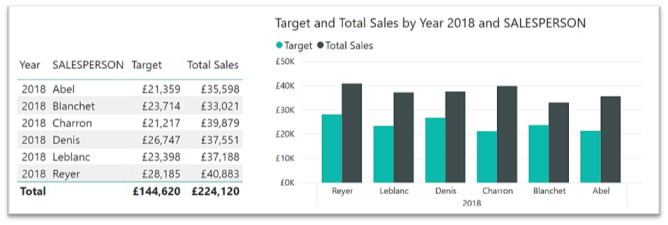
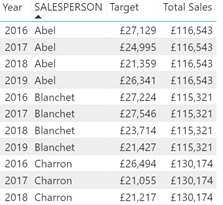
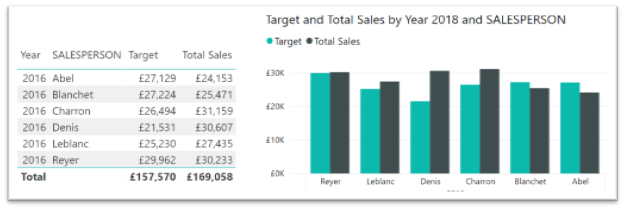
To understand the requirement for this relatioinship, let’s start with a scenario. I would like to compare Yearly Sales and Yearly Targets for my Salespeople and be able to generate a Table or Column chart visual as in this example (note we have filtered values for 2018 only):-
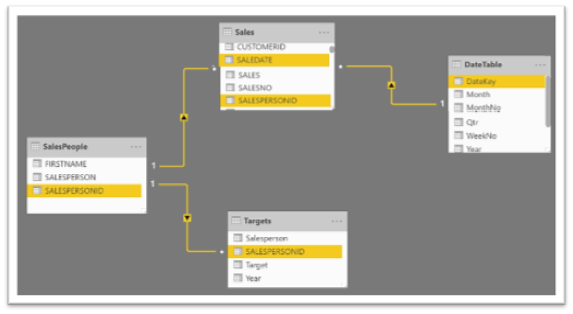
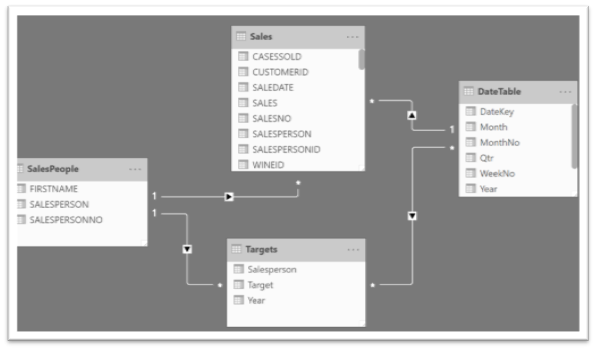
The data is recorded in 4 tables, Salespeople, Targets, Date Table and Sales Table
In actuality what really lies at the heart of the problem is one of granularity. My Sales and my DateTable record values at Day granularity but my Targets are recorded at Year granularity.
These tables are currently related to each other as follows:-
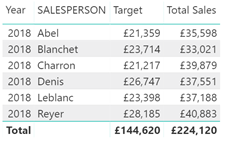
The problem will be how to get both the Total Target value and the Total Sales value in the same visual against Year. I get different calcuations depending in which table Year comes from as follows:
|
Year comes from the Date Table:- |
Year comes from the Targets table:- |
|
Image
|
Image
|
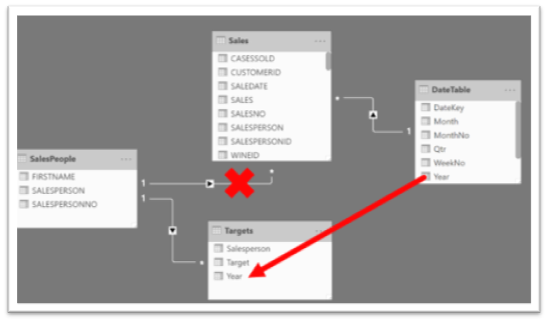
Looking at the model, we can see the problem. If I take Year from the Date Table, the Year filter is propagated to the Sales table to show sales for each year but this filter is not propagated onwards to the Targets table via the Salespeople table (the filter propagation stops at the Sales table, marked by the red cross below). If I take Year from the Targets table, this filter won’t propagate to any other tables.
What I want to be able to do is to filter Years in the Date Table that will then filter dates for that year in the Sales table and will also filter the years in the Targets table, shown by the red arrow below:-
However, when I attempt to relate Year from the DateTable to Year from the Targets table I get the message:-
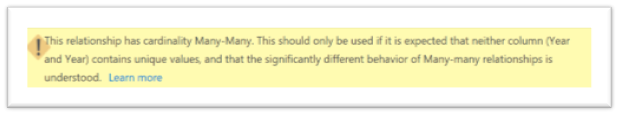
Apparently I need to understand this “significantly different behaviour“, otherwise I shouldn’t attempt to create the relationhip. So now I’m shaking with fear about what might happen!
So before I cast caution to the wind and create this relationhsip, lets take a step backwards in time and remember the good ol’ days when we couldn’t create this type of “Many-to-Many” relationship (I believe this feature came into Power BI in July 2018). In these dark old ages how did we cope with this scenario? Well, there were 2 approaches that we could use.
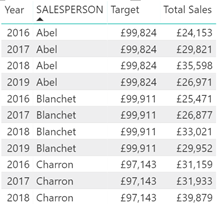
The first approach is similar to how we coped with the “conventional” many to many relationship described above i.e. we just need to create an additonal table and rather than going “one-to-many / many-to-one”, we just go the other way; we need a table where we can go “many-to-one / one-to-many”. This “bridge” table only needs to compise a unique list of years and can then be related into the model:-
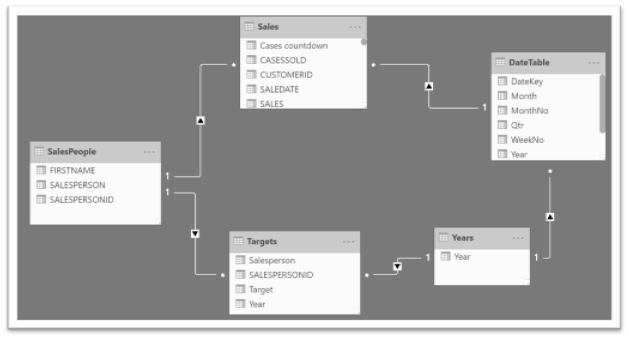
And now I just make sure that I take Year from the Years table:-
|
Year comes from the Years Table |
|
Image
|
There is another approach that we used in the old days and that doesn’t require any additional tables and that is to use the TREATAS function as follows:-
Target V2 = CALCULATE ( SUM ( Targets[Target] ),
TREATAS (
VALUES ( DateTable[Year]),Targets[Year] ) )
This creates a “virtual” relationship that matches Year values in the Date Table with Year values in the Targets table.
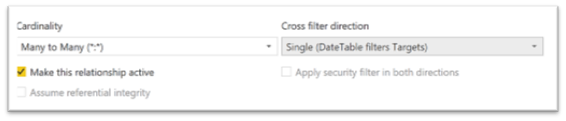
So that what we did before the advent of this new “cardinal” many-to-many relationship. Let’s now bite the bullet and go ahead and create it. Yet more complications I’m afraid! Notice that it’s not as simple as now just clicking OK. In order for this relationhsip to work, we have to change two things: make the relationship active and ensure that the cross filter direction is single, (DateTable filters Targets).
So now I’m finally ready to compare the Yearly targets to the Yearly Sales:-
Phew! Well, I hope you don’t need counselling after this explanation of such complicated relationships!
Understanding many to many relationships between tables allows you to create efficient data models in Power BI. Whilst this may seem complicated, it helps to bring meaning and insights to your data.
Our DAX for Power BI training course can help you to smooth out any issues you may be having and give you the skills to perform powerful DAX calculations. Visit our DAX training page to find out more about the course and get in touch to book your place.
Add new comment