Best and Worst: Two approaches to finding Top or Bottom N Percent using DAX
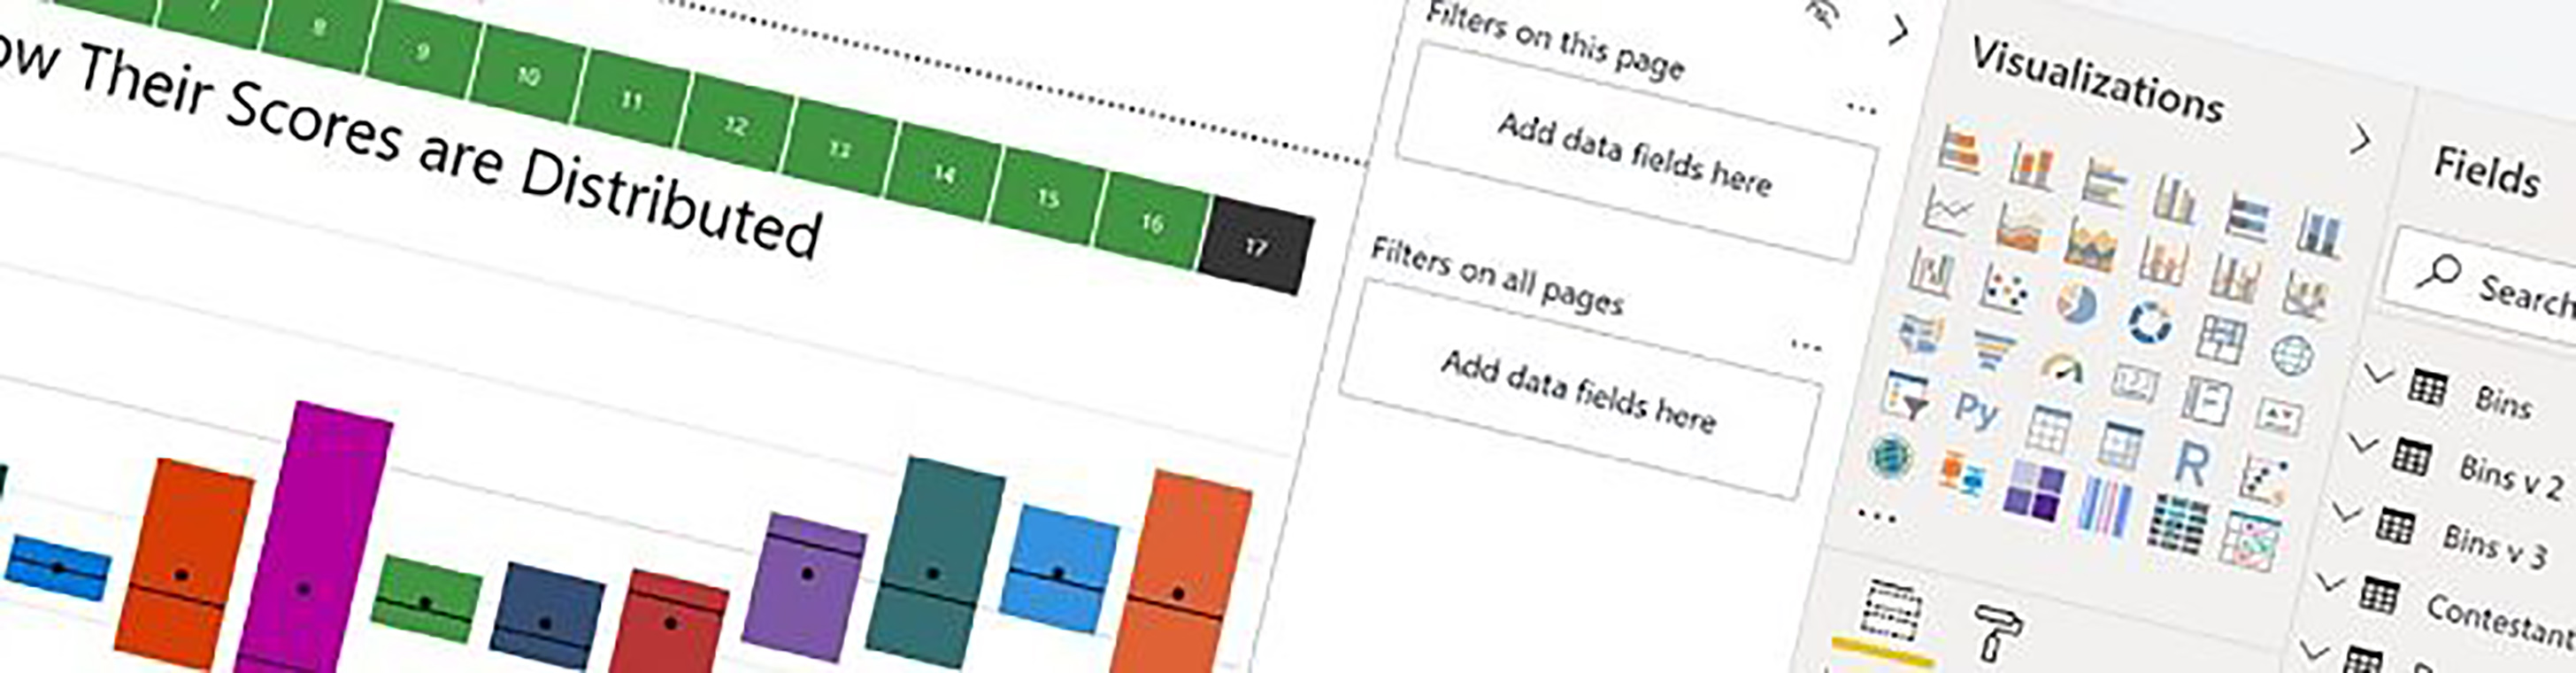
Ever wanted to find which are your best or worst customers or best or worst products by a metric such as Total Sales? Finding a simple TopN or BottomN (e.g. Top 10 Customers) in Power BI Desktop couldn’t be easier; just use the TopN Filter:-
But what about finding Top 10 Percent of a value like Total Sales? As the number of our customers or our products grows over time, finding a simple Top 10 or Bottom 10 of a value may not be as insightful as finding the Top 10 Percent or Bottom 10 Percent.
So how do you go about finding Top or Bottom Percent of a value?
There many ways to do this, here are a couple; a basic approach that just finds a specific percentage (e.g. Top 10% or Top 20%) and a more dynamic approach that allows you to use slicers to select the percentage you’re after.
Both these approaches require the creation of a calculated column that ranks your customers or products by best and by worst. To do this, go to your Customers or Products table and select the “New Column” button on the Modelling tab.
For Top Percentage you’ll need to rank your customers by best first, use this DAX expression:-
Customers Ranked Top = RANKX (Customers,[_Total Sales])
For bottom Percent, reverse the ranking to get worst first, use this DAX expression:-
Customers Ranked Bottom = RANKX (Customers,[_Total Sales] , , ASC)
Now let’s look at calculating the Top 10% of Customers by their Total Sales, firstly by finding a specific percentage and then being able to select different percentages.
Approach No. 1 – Finding a Specific Percentage e.g. Top 10%
To do this, create two Measures using the New Measure button on the Modelling tab.
This is the DAX measure you need for Top 10%:-
Top 10 Percent = VAR Rank_To_Find = COUNTROWS ( ALL ( Customers) ) * 0.1 RETURN CALCULATE ( [_Total Sales] , FILTER ( Customers,Customers[Customers Ranked Top]<= Rank_To_Find))
….And this is the measure for Bottom 10%:-
Bottom 10 Percent = VAR Rank_To_Find = COUNTROWS ( ALL ( Customers) ) * 0.1 RETURN CALCULATE ( [_Total Sales] , FILTER ( Customers,Customers[Customers Ranked Bottom]<= Rank_To_Find))
Now to explain the how these measures work. The COUNTROWS and ALL functions count all the rows of the Customers table e.g there are 84 row in the Customers table. The total number of customers is multiplied by the percent you want divided by 100 e.g. for our 84 Customers this would be 84 * (10 / 100) = 8.4. So we need to find the Top 8 Customers by Total Sales (I’ve rounded the 8.4 up to 8). The CALCULATE and FILTER functions filter out customers whose rank falls within this value i.e. ranked between 1 and 8. For Bottom 10%, this would just be the Customers whose Bottom rank falls from 1 to 8.
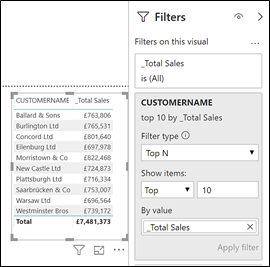
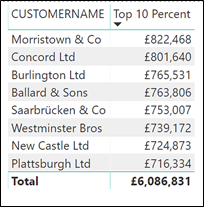
These are what these measures look like when placed in Table Visuals.
|
Image
|
Image
|
However, this assumes that you want to find the Top TEN percent. What about Top 20%, 30%, 40% etc or even Bottom percentages?
Approach No. 2 – Using Slicers to Find Different Percentages
This approach requires two steps:-
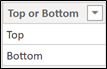
- Create the slicers to select which Percentage and whether Top or Bottom
- Create the Measure for the Top or Bottom Percent selected from the slicers
Create slicers to select which Percentage and whether Top or Bottom
To create these slicers, you need to create two tables, using the “Enter Data” button on the Home tab:-
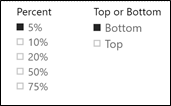
I’ve called these tables “Percent” and “Top or Bottom”. Both tables contain a single column (also called “Percent” and “Top or Bottom”), as show here:
|
Percent Table |
Top or Bottom Table |
|
Image

|
Image
|
Note you will need to format the Percent column as Percentage (use the modelling tab and the % button in the formatting group)
Now create two slicers using the “Percent” column from the “Percent” table and the “Top or Bottom” column from the “Top or Bottom” table.
Create the Measure to Find the Top or Bottom Percent selected in the Slicers
Now create this measure:-
Top/Bottom Percent = VAR Rank_To_Find = COUNTROWS ( ALL ( Customers) ) * SELECTEDVALUE('Percent'[Percent]) VAR Top_or_Bottom = SELECTEDVALUE('Top or Bottom'[Top or Bottom]) VAR Top_PC =CALCULATE ( [_Total Sales] , FILTER ( Customers,Customers[Customers Ranked Bottom]<= Rank_To_Find)) VAR Bottom_PC = CALCULATE ( [_Total Sales] , FILTER ( Customers,Customers[Customers Ranked Top]<= Rank_To_Find)) RETURN IF (Top_or_Bottom = "top", Top_PC, Bottom_PC)
Use this measure in your Table visual and slice by Percent and Top or Bottom:-
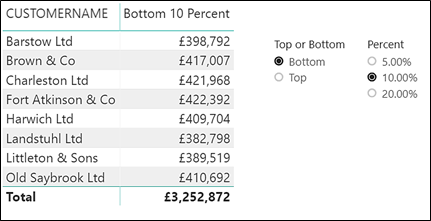
You’ll see you can dynamically change whether to slice by Top percentage or Bottom percentage and you can also dynamically can change the Percentage value.
So there it is; finding our best and worst with a little bit of DAX and slicers. This is what we love about Power BI that if we know how, getting to these insights is really quite simple.
Benefit from expert training
At Burningsuit we have years of experience in providing expert, well-rated training courses in Power BI, DAX and Excel. We’re adept at providing the information and skills you need to make the most of Power BI together with your data and offer on-site and public courses across London and the UK.
To contact us, please call on 0800 0199 746 – we’re always happy to discuss Power BI training and implementation. If you’d like to book onto our next public Power BI course in London, visit our Power BI page.
Add new comment