Charticulator in Power BI #11 – Guides, Guide Coordinators & Anchoring
Guides, Guide Coordinators & Anchoring.
Have you been wondering why elements of your Charticulator chart won’t stay where you put them? If the answer to this is “yes” then you need to read this post. You see, what you probably haven’t understood is that for anything placed on the canvas or in the glyph pane to stop wandering around, they must be anchored to a guide. This can be one of the default guides or it can be a guide or guide coordinator that you have placed there.
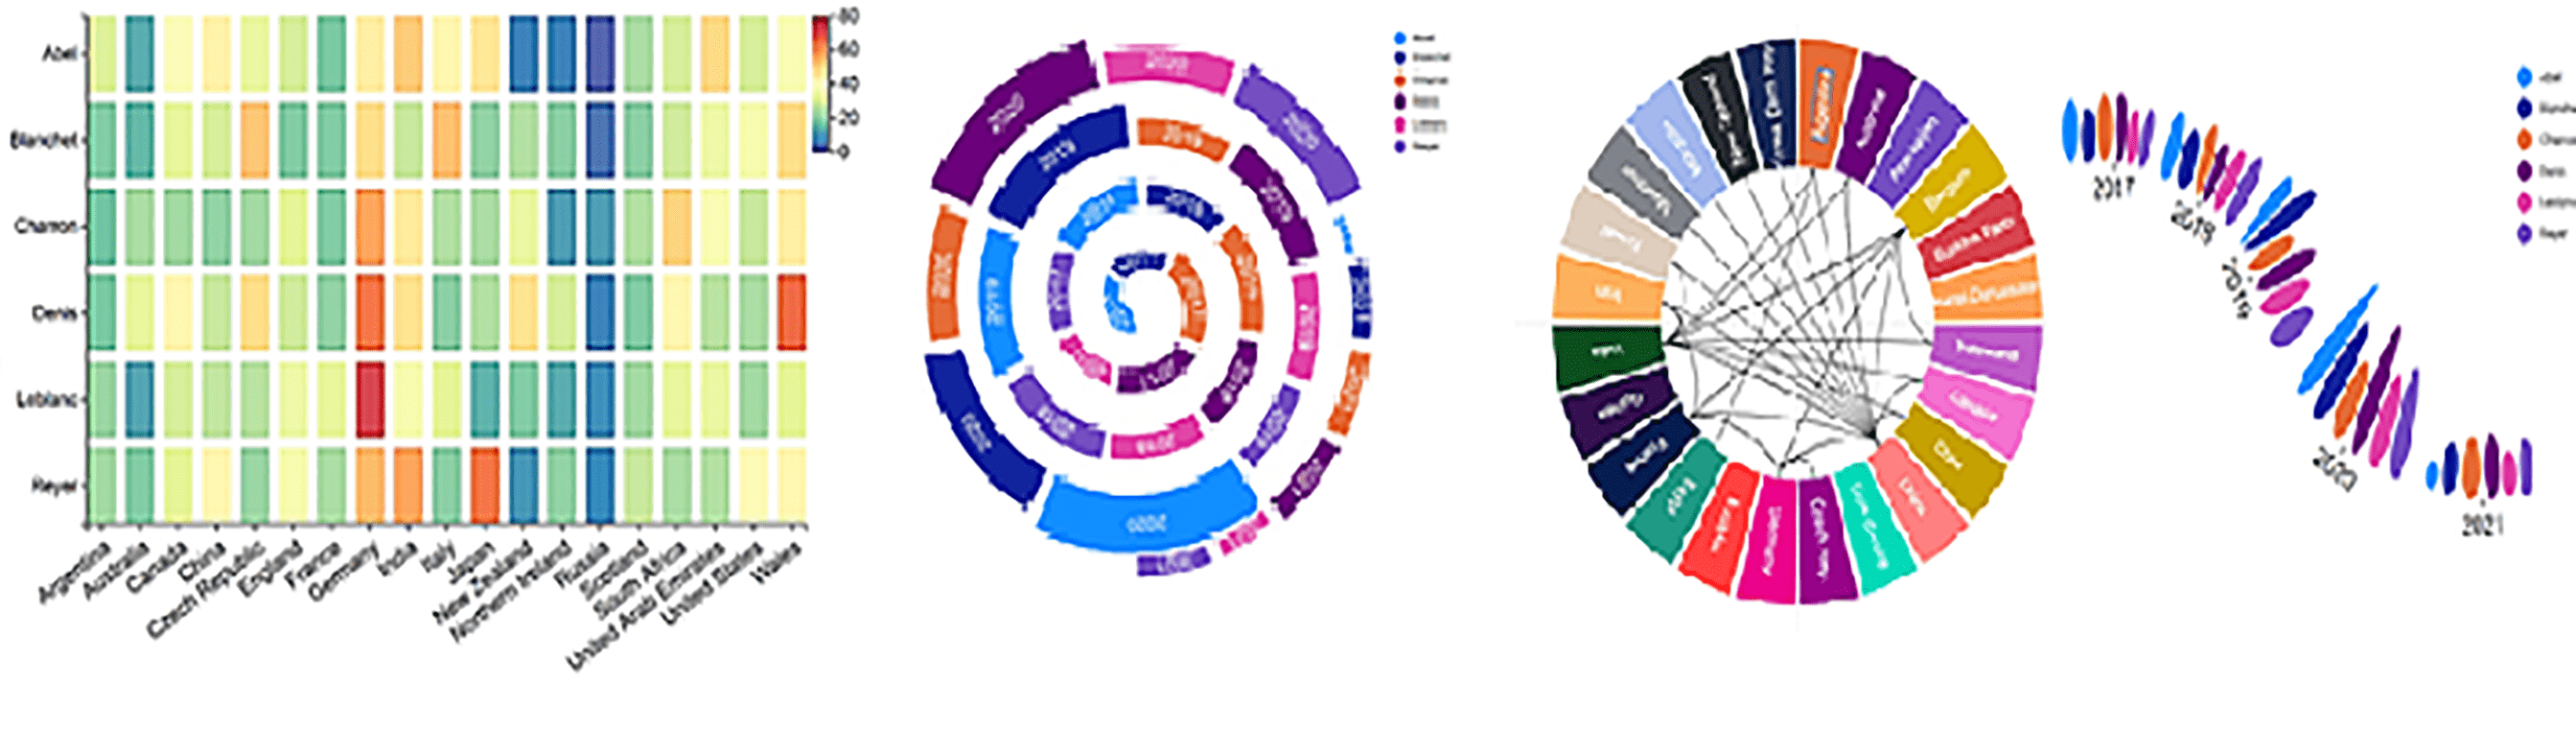
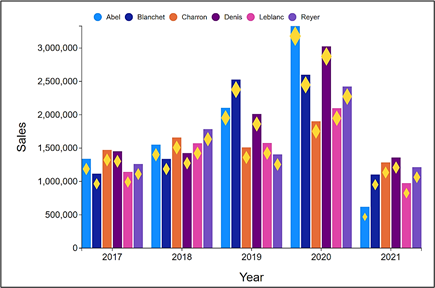
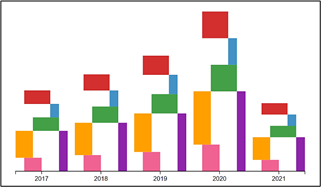
Consider the chart below. You will see a number of elements that have been anchored to either default guides or user created guides, including the X and Y Axis Titles, the Legend and the diamond Symbol in the glyph.
When we save this chart, these elements will stay where you see them now and won’t wander some place else! Let’s first look at the different types of guides we can anchor elements to i.e. default guides or user created guides, and then we will focus on the anchoring process itself.
Default Guides
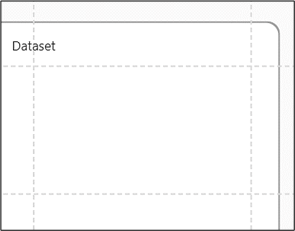
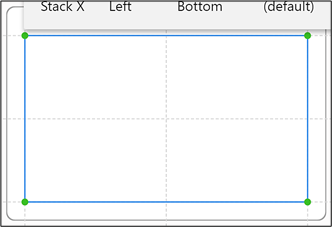
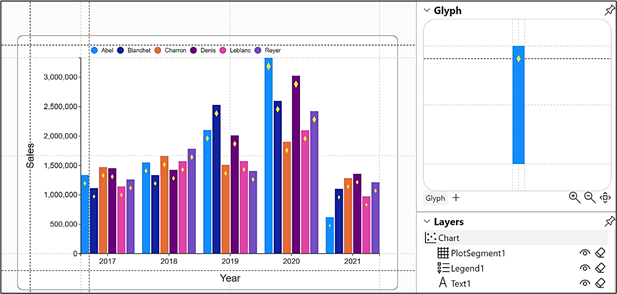
When you first create a chart, you have a number of default guides created for you both on the canvas and in the glyph pane. They appear as faint grey lines and on the canvas they mark out the margin space and the centre points horizontally and vertically. The plot segment has to be anchored to these guides. In the Glyph pane, the guides mark out the boundary of the glyph also the centre points, both horizontally and vertically. and again, the Glyph has to be anchored to these guides.
|
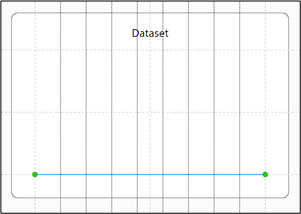
Default guides on the canvas. |
The plot segment must be anchored to a guide |
|
Image
|
Image
|
|
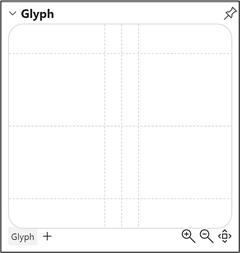
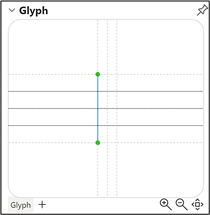
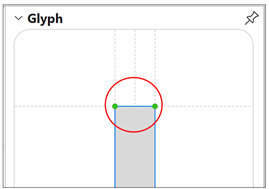
Default guides in the Glyph pane. |
The shape or symbol must be anchored to a guide |
|
Image
|
Image
|
You can add your own guides to the canvas or to the Glyph pane and anchor elements to them.
Creating Your Own Guides
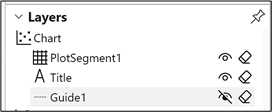
You can create your own horizontal or vertical guide by selecting from the Guides button
on the menu bar. Then click into either the chart canvas or the Glyph pane to create the guide. The guide will now be listed in the Layers pane:-
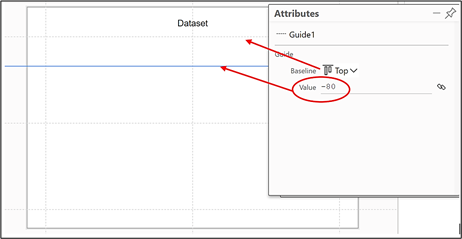
Select the guide in the Layers pane and open the Attributes pane for the guide. The guide must be offset from one of the default guides on the canvas or in the glyph pane e.g. for horizontal guides the guide must be offset from the Top, Middle or Bottom of the canvas or glyph pane.
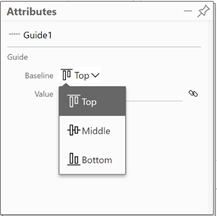
You must enter a value that represents how much you want to offset the guide from one of the default guides on the canvas.
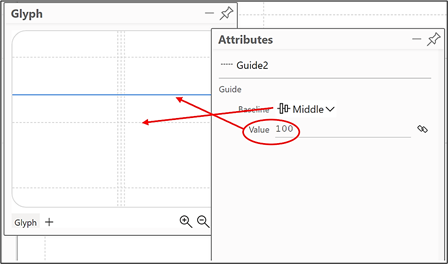
You can do the same to put guides into the Glyph pane.
If you want to reposition a guide, edit the “Value” in the Attributes pane as in the above example. You may find dragging the guide places it back on the default guide when you save the chart.
Creating Guide Coordinators
You can add a horizontal or vertical grid of guides for either the canvas or the glyph pane by clicking on the Guides button drop down on the Menu bar and selecing e.g. Guide X
To secure the guide coordinator, you must anchor them to an existing guide by dragging along the guide
|
Image
|
Image
|
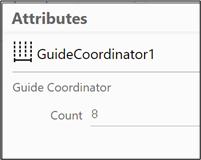
You can then edit the number of guides in the grid by using the Attributes pane of the guide coordinator.
|
Image
|
Image
|
Image
|
Anchoring to Guides
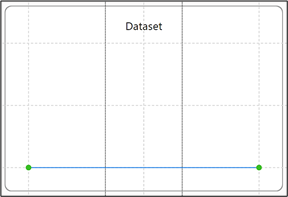
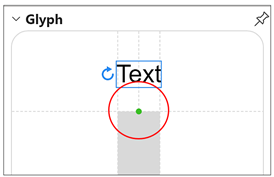
Once you’ve created your guides or guide coordinators, you can start to anchor elements to them. Everything in your Charticulator chart must be anchored to either a default guide or a user created guide. All chart elements have drag handles that show as green dots. To anchor an element, drag the anchor handle onto the intersection of a horizontal and a vertical guide. You need to always make sure that the green anchor handles are anchored to a guide. You can see some examples of anchoring chart elements to guides below:-
|
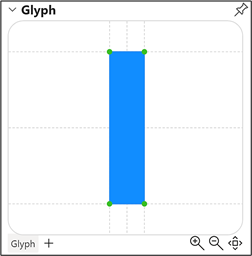
Anchoring a Text mark to the top centre of a rectangle |
A rectangle mark anchored to the Glyph guides. |
||
|
Image
|
Image
|
|
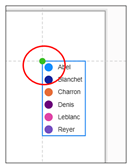
Anchoring a legend on the canvas |
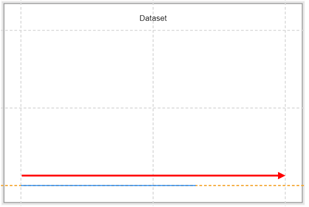
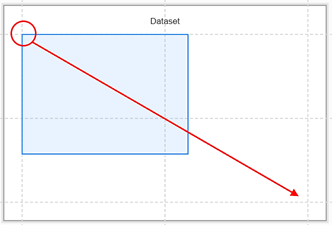
You must anchor plot segments to a guide, for example by dragging diagonally across the canvas. |
||
|
Image
|
Image
|
||
|
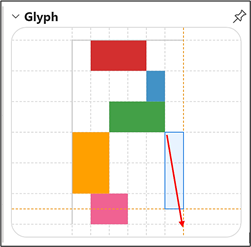
Creating additional guides and anchoring multiple rectangles to them… |
…ends up as this glyph |
||
|
Image
|
Image
|
||
These are the guides that we need in our chart to anchor the Legend, the Axes Titles and the diamond Symbol in the glyph.
So now you know that in Charticulator you have to create guides to anchor any additional elements you’re thinking of placing on the canvas or in the glyph. However, there is another area of Charticulator that I expect you’re still a bit foggy about and that is the matter of Scaffolds. What are they and why would you need to use them? Yes, you’ve guessed it, this is the subject of my next blog post.
Add new comment