Top 10 Power BI Desktop Annoyances
You know that moment when you’re using Power BI Desktop and you start swearing under your breath? I have to admit I don’t often do this but when I do, boy do some things annoy me! So just to get things off my chest and have a good old rant, I’ve listed my top 10 annoyances in Power BI Desktop and notice I haven’t even mentioned the ridiculously small default font used by visuals.
No. 1: I Can’t Easily Find the Options for Conditional Formatting
Why? Because they’re nowhere to be found unless you just happen to be hovering in exactly the right place. Take the conditional formatting options for a Clustered Column, I have to hover exactly over “Default color” and a rather tiny greyed out vertical ellipsis suddenly appears out of nowhere. Who would think; “Oh well that’s really obvious”!
No. 2: I Can’t Apply Conditional Formatting to the Rows of a Matrix
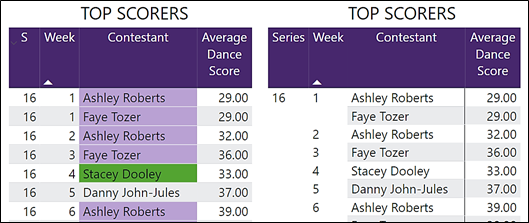
… but I can apply conditional formatting to text values in a Table visual. This is so annoying. For instance, in the two visuals below, the one on the left shows conditional formatting in a Table Visual but when I convert this visual to a Matrix (on the right), the conditional formatting disappears I need to the Matrix not the Table because I don’t then get repeating values in the Matrix.
No. 3: Conditional Formatting Colours Don’t Update When You Change Themes
This used to be the case with all Themes, but I’ve noticed that since the choice of themes has grown, this now only applies to Themes listed under “More Themes” as in this list:-
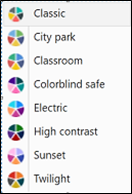
So if I select any of the above themes, I get the same colour choice in the Conditional Formatting options:-
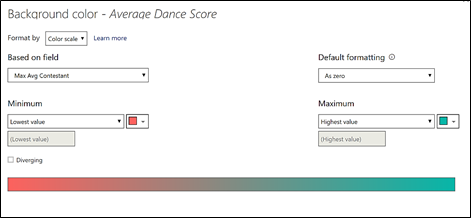
So if I decide to swap out a theme, I have to go to each visual where I’ve got conditional formatting and manually re-select colours from the new Theme. This has often taken me some considerable time so you don’t want to be around the hear the swearing!
No. 3: I Can’t Tell What Theme is Applied to a Power BI Desktop Report
Well, apparently, I can if I unzip the .PBIX file! Really? It would be good if the current theme was highlighted o the menu, or something, anything just to give a clue as to which color theme is applied.
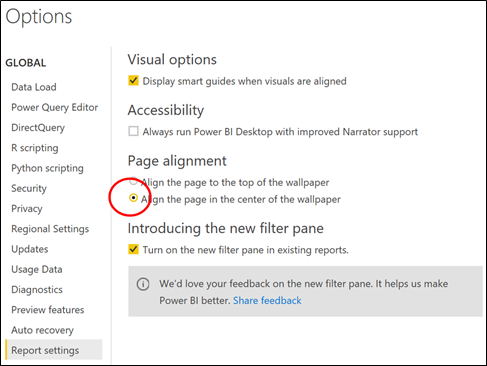
No. 4: The Canvas Sits by Default at the Top of the Wallpaper
As in this screenshot. Nice! I’ve got loads of space under the dotted line of the canvas to put …. well …what?
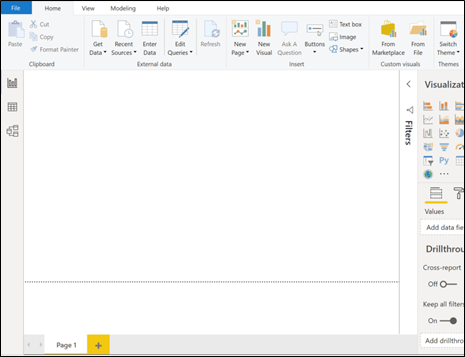
By the way this can be changed by changing this Option under the File tab:-
No. 5: I Can’t Tell What Bookmark is Applied to a Page
If I follow a link to a Bookmarked page, the Bookmark is highlighted in the Bookmarks pane, great!
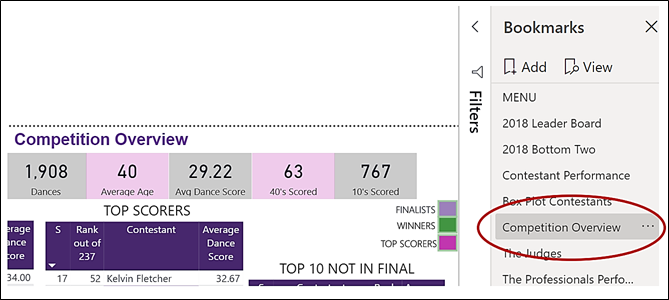
But if I’m just on a page I can’t tell what Bookmark is applied to that page:-
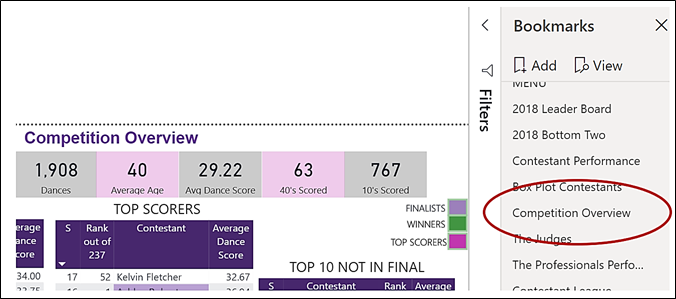
This is very annoying. It means I’m always having to following bookmarks to identify the one I need to change for a specific page.
No. 6: You Can’t Have Tiny Rectangles (or any tiny shapes for that matter)
Well you can but you have to drag the shape on the canvas to resize, which is very fiddly. You just can’t type low sizes in the Width and Height boxes in Format Shape:-
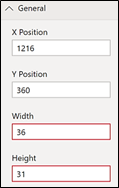
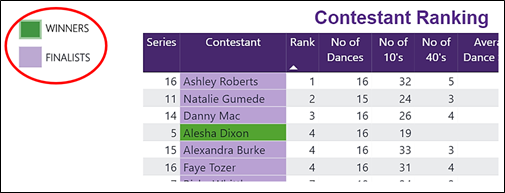
Why would I want tiny rectangles I hear you ask? Well, I need them to create keys to the colours I’ve used in Conditional Formatting:-
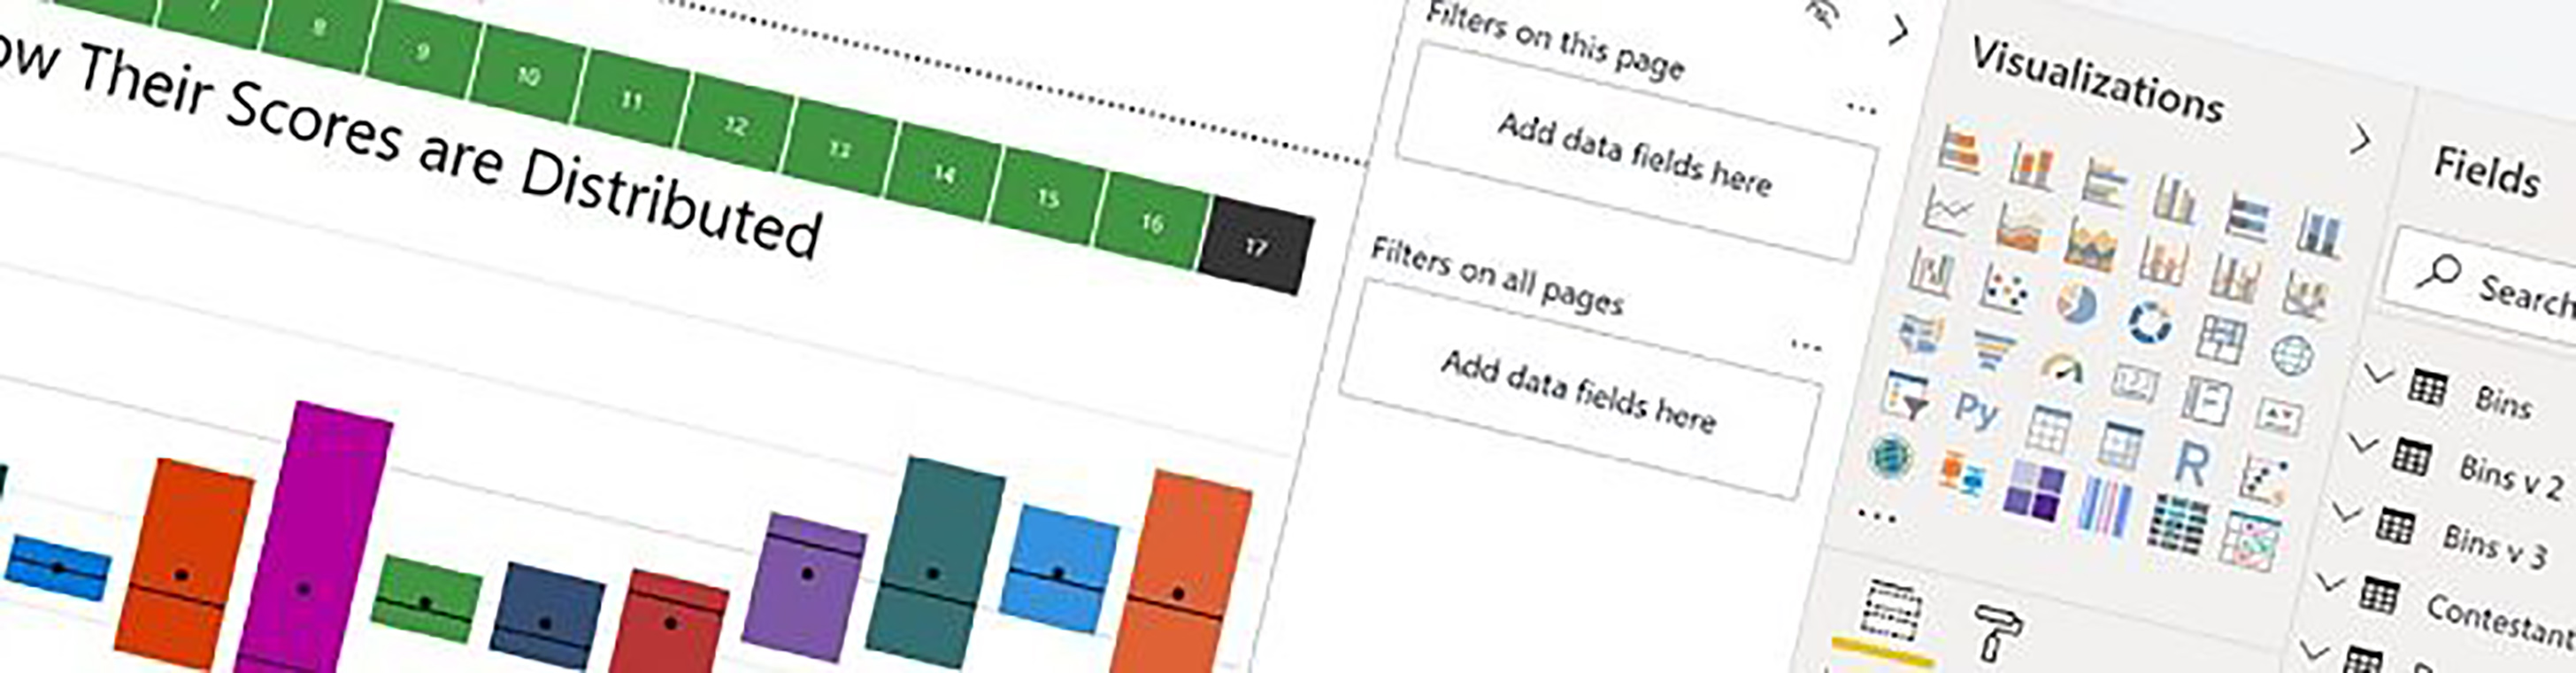
No. 7: The Default is “Continuous” on Bar Charts for Numeric X-Axis
As in this example:-
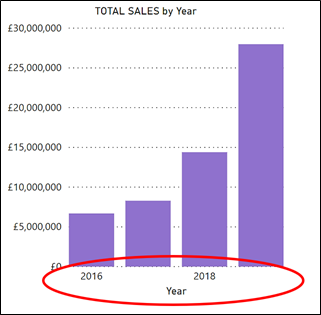
So under what circumstances would I not want each of these columns labelled?
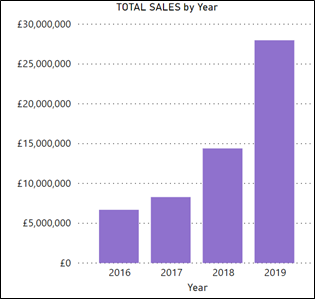
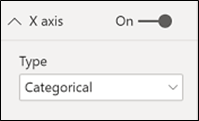
I know I can change the X-Axis from “Continuous” to “Categorical” on the X-Axis formatting card, but why do I always have to do this?
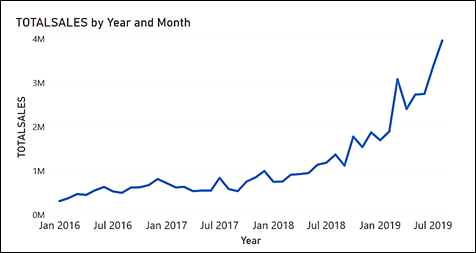
Surely a default Continuous X-Axis should only be applicable to Line Charts:-
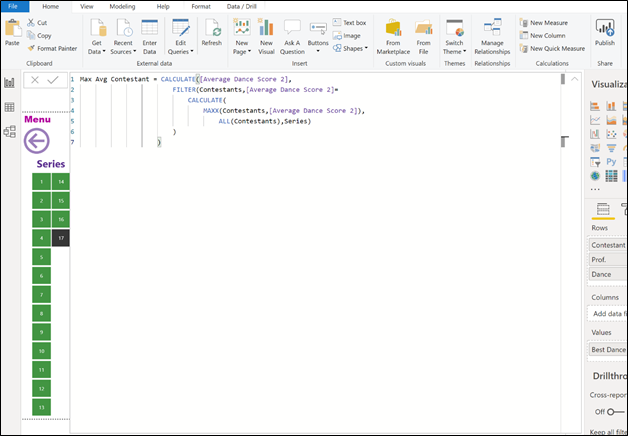
No. 8: The Size of the DAX Editor – It’s Too Big
If you expand the DAX formula bar, it turns into an “editor”. Why does this have to be so big? Who is constructing DAX measures that would use 34 or more lines? Anyway, the editor grows as you add more lines so why can’t the default expanded size be half this number of lines? What’s my annoyance with this? Well I can never see the visuals that are using the measure I’m editing. I just have a big white space!
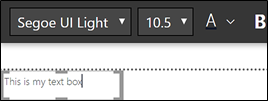
No. 9: The Teeny Weeny Default Point Size in Text Boxes
Why is the default point size in Text Boxes 10.5? I don’t want to write a novel into the Text Box, I normally only want it for a short annotation or a label. I said I wouldn’t complain about small point sizes, but generally, why does every point size default in Power BI Desktop just seem too darn small?
No. 10: I Can’t Easily Select Text Boxes
I often want to copy Text Boxes but as soon as you click on a Text Box, you’re in text editor mode indicated by the insertion point in the box and no amount of Ctrl C / Ctrl V will work. With a lof of deft clicking on the edge of the Text Box, you eventually stumble across selecting it, indicated now by the absence of formatting options:
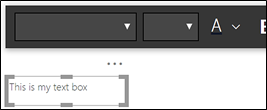
Great, but not awesome!
Thanks for letting me get these annoyances off my chest! If anyone knows any simple fixes for these annoyances (apart from “wait for the next release!”) It would be great to hear from you. Don’t get me wrong, I love Power BI, and the Desktop report generator, it’s great, but with just a few tweaks it could be awesome!
Here at Burningsuit we are proud to provide high quality, end user training courses that give you the skills to utilise Power BI effectively and efficiently. Discover more about our range of training courses on our Power BI training page, including fundamentals and advanced training, as well as DAX and Excel.
Get in touch with us on 0800 0199 746 to find out more about our courses and which is best for you.
Add new comment