What is the difference between BI reports and dashboards?

There is a misconception that the Power BI report is a detailed tabular report and that the dashboard is an interactive visualisations with charts. This isn’t the case and in order to build effective power BI solutions, you will need to understand the differences, and in a way that can help you to leverage their unique powers to the greatest possible effect.
After the February 2018 update to Power BI Service, both Reports and Dashboards can be shared. It’s a good thing to understand the differences between Report and Dashboards to work out which you want to share with others, as both offer different features and benefits.
A report can be information represented in any form, be it tables, charts, graphics or text. A dashboard, on the other hand, is simply a visual display of the most important information needed to achieve one or more objectives.
What is a Power BI Report?
Power BI Report lets you view various interrelated visual elements, such as charts, texts or values all on a single page. The data which you see in the report can be sliced and diced with slicers. In this way, the user can have full interactivity with the data and the ability to filter based on specific criteria.
What is a Power BI Dashboard?
With Power BI Dashboard you can get a high-level view of certain KPIs relating to one or more of your reports. Dashboard gives a day-to-day view of your KPIs, and provides a navigation point to the detailed reports.
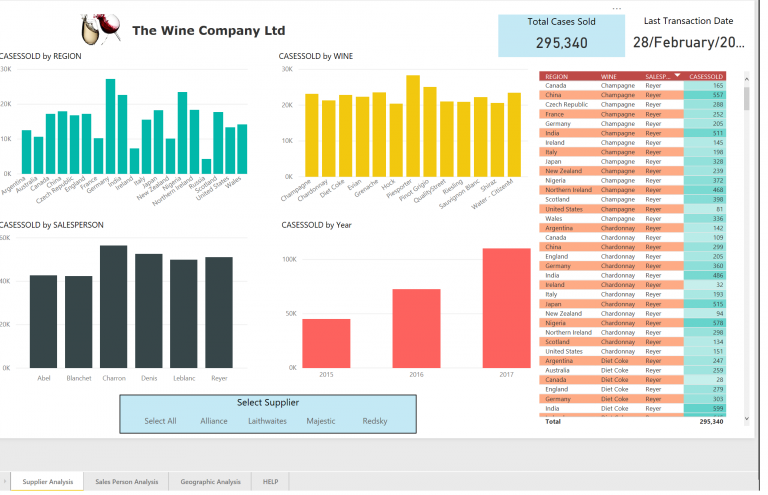
Power BI Report
Power BI Reports may feature multiple pages, each showing multiple elements. Hovering and highlighting, as well as slicing and dicing are possible in Report. You can also drill down through a hierarchical data structure, or even select a certain column in a chart and see the data related to it in other visualisations.
This view also allows you to manipulate different handles such as slicers, visuals and filters. For example, if you want to understand why August’s sales are lower than September’s or to see which product is your best seller across various branches.
Unique Features of a Power BI Report
- Slicers – Slice and dice the data in the report with slicers as you need to
- Multi-Pages – Navigate between pages via the pane at the bottom
- Interactivity – Select an element in a chart and it will highlight other elements so you can get more insight
- Drill Down/Up – With hierarchies like Product Group or Calendar, you can drill down or up to different levels through visualisation elements
- Publish to Web – Publish reports as public web pages or embed them in web page
- Explore Data – Drill down to the record level and see the roots of a particular value in a chart
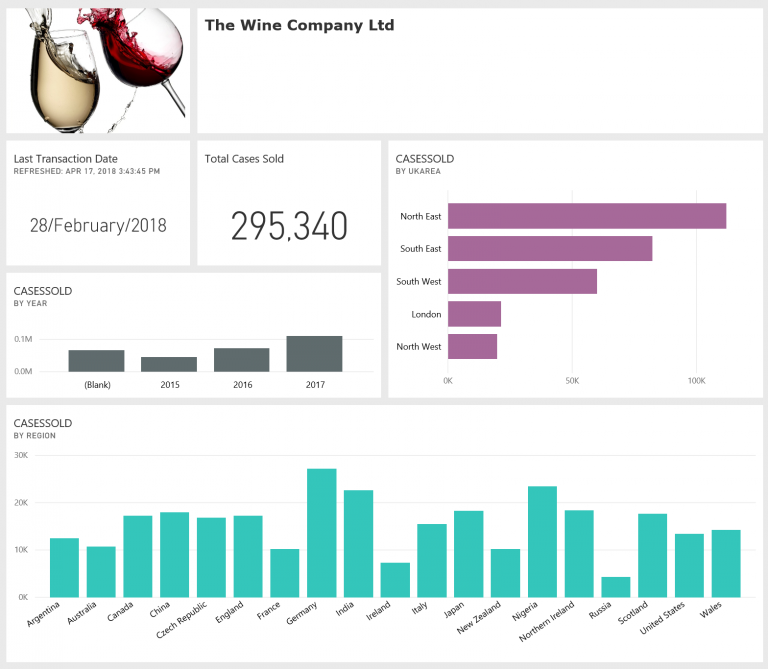
Power BI Dashboard
Power BI Dashboard allows for navigating to reports. It also provides a high-level view of a business’ main KPIs. If a business needs to see year to date revenue from sales reports, an inventory report and a production report, Dashboard can visualise multiple reports and pages and pin them in one place. This then works as a navigation point, and by clicking on these visuals, the user is directed to the report and page with that element.
Unique Features of a Power BI Dashboard
- Automatic Refresh – It can be open for many hours and will refresh automatically
- User Customization – Change dashboard tile sizes and order, and add new tiles such as image, text, web, and video
- Featured Dashboard – Set a featured Dashboard as a landing page
- Alerts – Set alerts for each data driven tile, like notify me if a certain number goes above or below a threshold
- Related Insights – Search through patterns in the data set and visualise them to gain greater insight
Summary
Dashboard and Report are different. The main difference is that Dashboard is a day-to-day single page view of your principle KPIs. This can be refreshed automatically and used to view real-time events. Dashboard is also used to navigate to reports.
Report is interactive data visualisations which users can slice and dice, highlight and manipulate to further investigate and gain greater insight. Rather than being alternatives, they are complementary products which work side by side.
Our training courses
Understanding the different tools within Power BI will enable you to make the most of your business data and create strategies to maximise your success. We run both public and private Power BI courses in London and would love you to join us. Whether you are just starting out and want to get to know the basics of Power BI, or are looking for a more advanced course to improve your reporting, we can help!
Browse our latest courses online and for more information, please call 0800 0199 746.
Add new comment