Why You Should Never Assume Your DAX Code is Correct; Taking a Closer Look at Bi-Directional Filtering
I recently listened to a thought-provoking blog from Alberto Ferrari (https://ssbi-blog.de/podcast/experts-talk/chat-with-alberto-ferrari/). In it he says,
“What scares me is the amount of people that are building reports that are wrong, that are producing wrong numbers but don’t know that. They just trust the numbers they see because they have no way of controlling them or debugging them. Maybe they don’t have the knowledge to correct them.”
So in other words, we must never just believe the numbers that DAX gives us; we must always look for correlation and proof they are correct. I’ve got a really good example of what Alberto is talking about and it’s all to do with using bi-directional filtering, whether it’s because you’ve edited the relationship or because you’ve used the CROSSFILTER function.
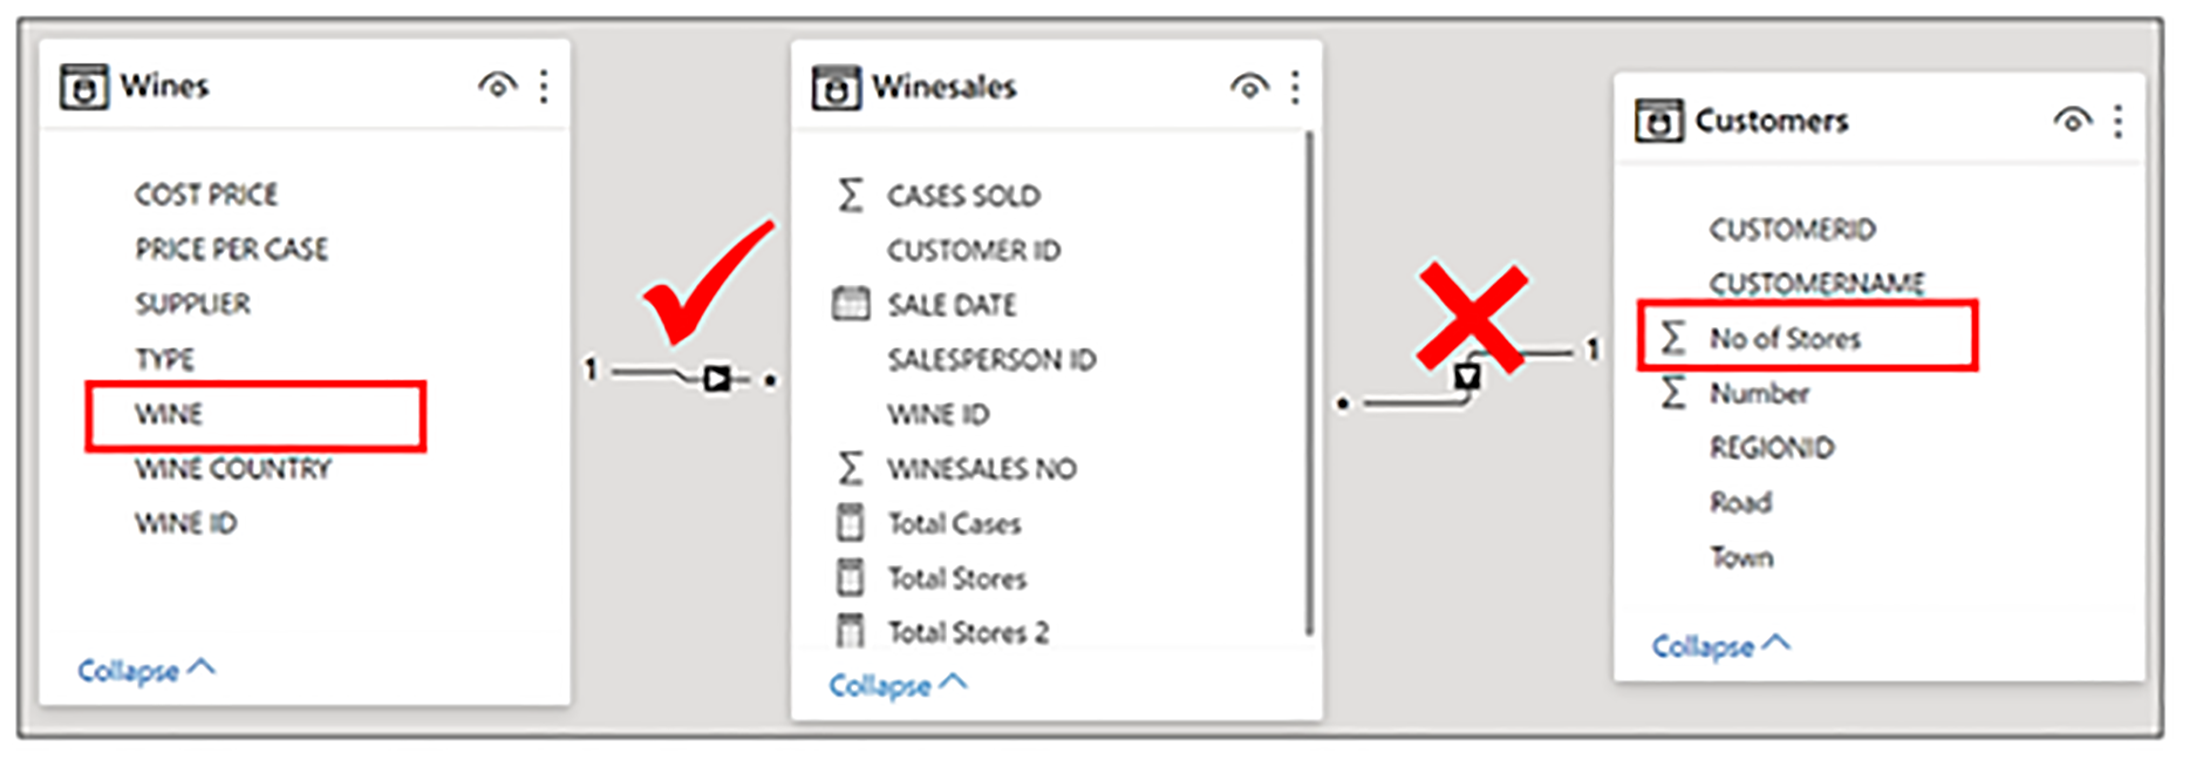
Let’s take this scenario. Looking at the data model below, we have a Winesales fact table with our Wine data and Customer data both sitting in dimension tables. In the “WINE” column of the Wines dimension we record the name of each wine we sell and in the “No. of Stores” column in the Customers dimension we record the number of stores that a customer owns.
We want to calculate the total number stores in which we’ve sold each wine. However, we can see we have a problem; filters don’t flow from the Wines dimension through to the Customers dimension:-

So this measure….
Total Stores =
SUM ( Customers[No of Stores] )
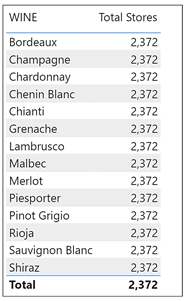
…will return these values:-
I bet you’re now thinking; but all I need to do is edit the relationship between Winesales and Customers to a bi-directional filter…
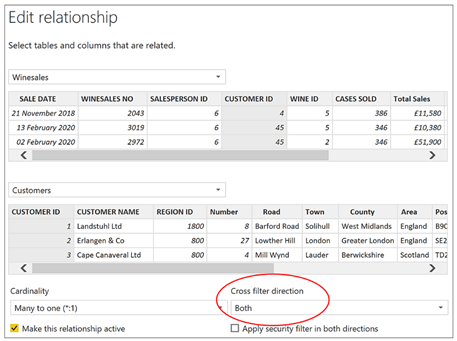
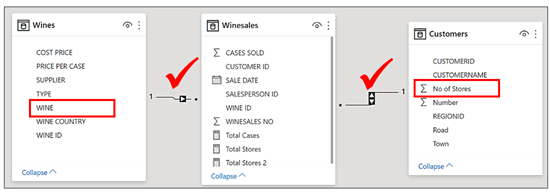
…so the filter now flows from the Wines dimension through to Winesales fact table and now onward to the Customers dimension:-
Or even better still, you could use the CROSSFILTER function to programmatically change the direction of filter propagation in the evaluation of the measure, like so:-
Total Stores =
CALCULATE (
SUM ( Customers[No of Stores] ),
CROSSFILTER ( Winesales[CUSTOMER ID], Customers[CUSTOMER ID], BOTH )
)
Either way, we will now get the correct number of stores in which we’ve sold our wines. But hang on a minute! Are these numbers correct?
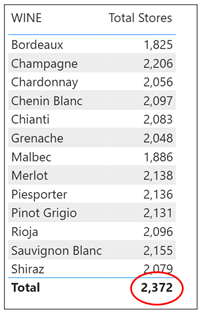
Many of the same customer will have bought each wine, so we know that the Total of 2,372 (circled) will not be the sum of the values above. However, we might think this value looks about right and so believe it. The value in the Total row should be the total number of stores in which we’ve sold all our wines. But is it?
The answer is no, it’s not!
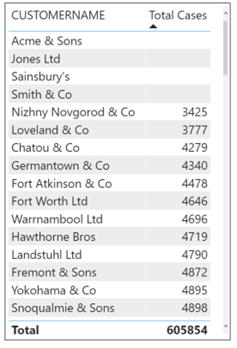
It’s not correct because in the Customers table there are four customers to whom we’ve sold no wine. If we “show items with no data” in a table visual when we calculate the Total Cases they’ve bought, we can see who they are:-
The Total Stores value of 2,372 showing in the Total row includes the stores for these customers:-
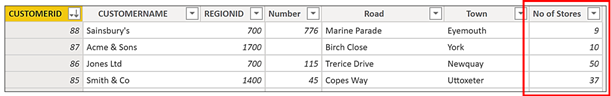
We haven’t sold any wine to these customers so clearly their stores should not be included in the Total number of stores in which we’ve sold all our wines. Our total is our by 106.
What’s happening here is that when a measure that
uses bi-directional filtering arrives at the evaluation of the Total row, the filters are removed from the WINE column of the Wines dimension and therefore there is no filter to propagate to the Customers dimension. In other words, bi-directional filtering is only active if filters are active.
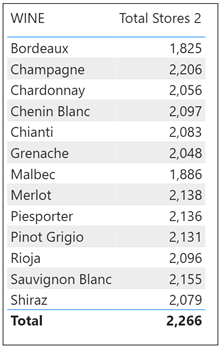
How do we calculate the correct value of 2,266 in the Total row? Alberto talks about not being able to control the numbers and that “maybe they don’t have the knowledge to correct them”. So how easily we can answer this question depends on our knowledge of DAX.
What we can do is use the expanded Winesales fact table as the filter for the Customers table. For more information on the use of expanded tables in DAX, visit https://www.sqlbi.com/articles/expanded-tables-in-dax/.
This is because unlike bi-directional filtering, filters from expanded tables are always active. When the Total row is evaluated the expanded Winesales fact table contains only those Customers who have bought wines and so this will filter the Customers dimension accordingly.
This is the measure that will give us the correct total:-
Total Stores 2 =
CALCULATE (
SUM ( Customers[NO OF STORES] ),
Winesales
)
So not only do you have to have beady eyes and a suspicious mind to work with DAX, you need to also understand DAX.
In his podcast Alberto Ferrari goes on to say:-
“As of today we take for granted that whatever we see on a screen is correct. We think that people actually debug their numbers but in my experience that doesn’t happen so often or at least not enough.”
And what is his solution for this unsatisfactory state of affairs? More and better training. I wholeheartedly agree, but then I would, wouldn’t I?
Add new comment