 The Key Influencers Visual Versus Strictly Come Dancing20th January 2020The Key Influencers visual , introduced in February 2019, is Microsoft’s first visual that uses “Machine Learning” to identify factors that influence the outcome of a particular metric. “Wow”, I thought! The idea of leaving Power BI to do all the...
 Find a Value in the Previous Row18th November 2019Recently I was asked by one of our clients to solve this question; how could they calculate the number of days between customers’ transactions...
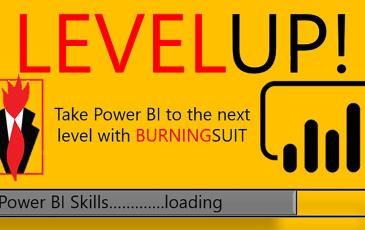 Level Up! Take your Power BI Skills to the next level with Advanced Training16th September 2019This week we’re delighted to announce the availability of our new advanced Power BI courses. We offer a full range of courses to take users from their...
 It’s Complicated – Dealing with Many-to-Many Relationships in Power BI31st July 2019If you’re building a DataModel in Power BI, and creating relationships between tables you may have come upon this message. What the heck does “...
 Best and Worst: Two approaches to finding Top or Bottom N Percent using DAX19th May 2019Ever wanted to find which are your best or worst customers or best or worst products by a metric such as Total Sales? Finding a simple TopN or BottomN...
 Four DAX Functions You Can’t Live Without21st November 2018Data Analysis Expressions, known as DAX , is the Function language that is used to solve data analysis problems in Power BI . DAX is used in the much...
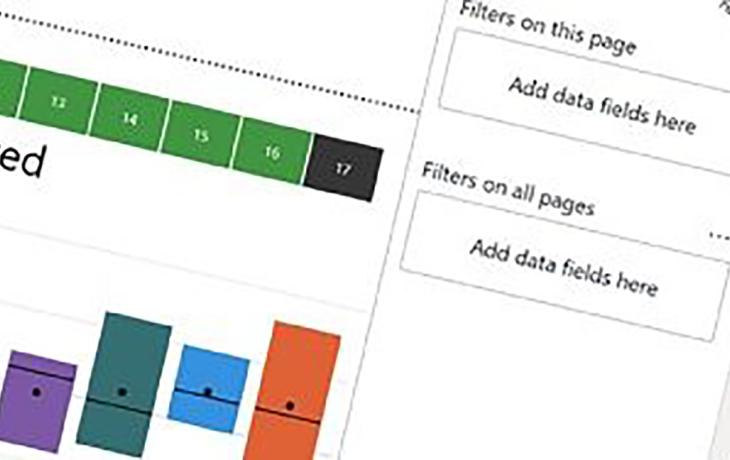
 DAX: Is the Total Row in a table giving you grief?9th July 2018If you are having issues with the total row of tables in DAX, this may be a familiar sight: When actually, all you want is this: So, what’s going on...
Blog
As Microsoft software evolves and new opportunities to enhance your data visualisation and integration evolve through Power BI, we like to keep you up to date. Our blog not only looks at new developments but shares consultancy news and training opportunities. Sign up to our blog to stay in touch.
