Filtering Using DAX Measures

A question that we are often asked is this; can you put a measure into a Slicer? The answer of course is no, only columns from tables can be populated into Slicers. The reason why this question so often arises is that most people see the Slicer as the most important filtering tool on the report.
However, if you want to filter data using values returned by measures, this is where the visual level filter using the Filters pane comes into its own. One of the defining differences between using the Filters pane and using Slicers is that in the Filters pane buckets, you can put DAX measures to generate visual, page or report level filtering. However, when using measures to filter data, you will mostly use a visual level filter to constrain the filter to specific visuals. What’s more, the measure on which you want to filter does not have to be placed in any of the buckets that comprise the visual.
Let’s now look at some examples of using measures in the Visual Level filter bucket of the Filters pane.
Using Measures to Filter Items with No Data
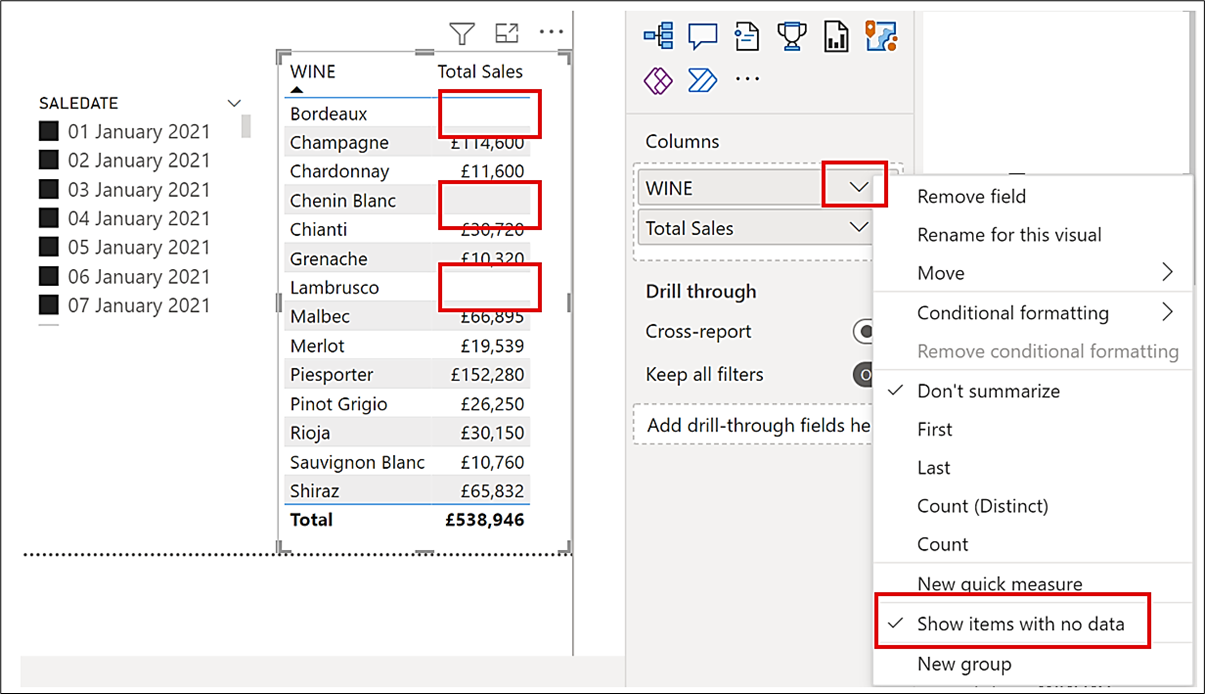
If you want to analyse data for which there are no values to show, for example, products for which there are no sales, using a measure in the Visual Level filter makes this analysis easy. For example, you can see in the Table visual below that we are using the WINE column from a dimension table and “Total Sales” is a DAX measure. We are looking at the first seven days in January 2021 and have used the “Show items with no data” on the WINE column of the table visual to see that “Bordeaux”, “Chenin Blanc” and “Lambrusco” have no Total Sales for these days.
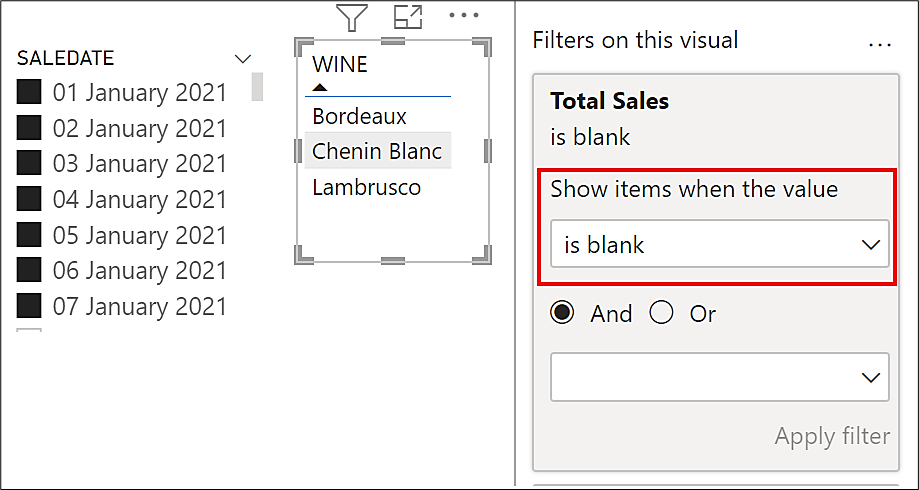
If we now only want to show items with no data in the visual, we can use the visual level filter in the Filters pane to filter values that are blank. We can then remove the “Total Sales” measure from the Table visual because there are no values to see:-
Filtering Categories Returned by a Measure
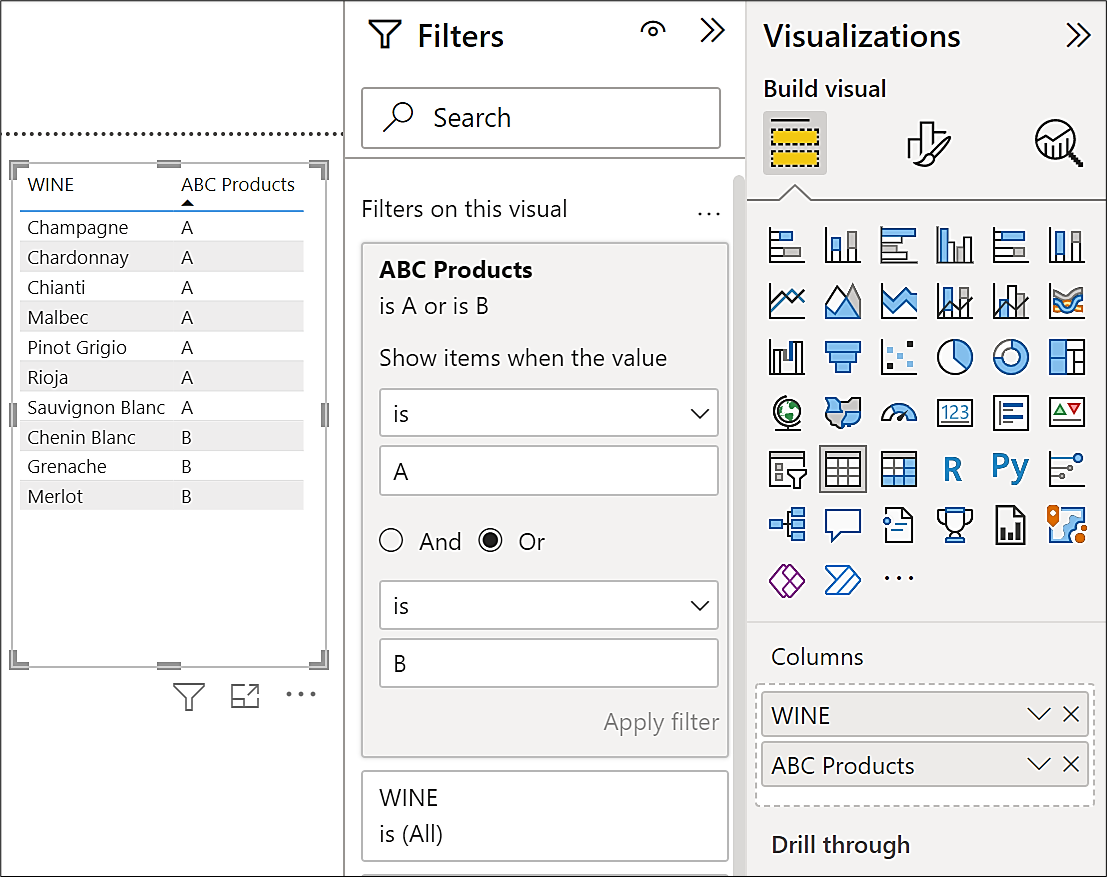
For example, we may have a measure (“ABC Products”) that categorizes our wine products by A, B or C based on Pareto analysis. We want to browse our products by classification on an ad hoc basis so restricting the measure to return a specific category is not what we want. We could instead use a visual level filter to filter the products accordingly: -
Filtering Numerical Values Returned by a Measure
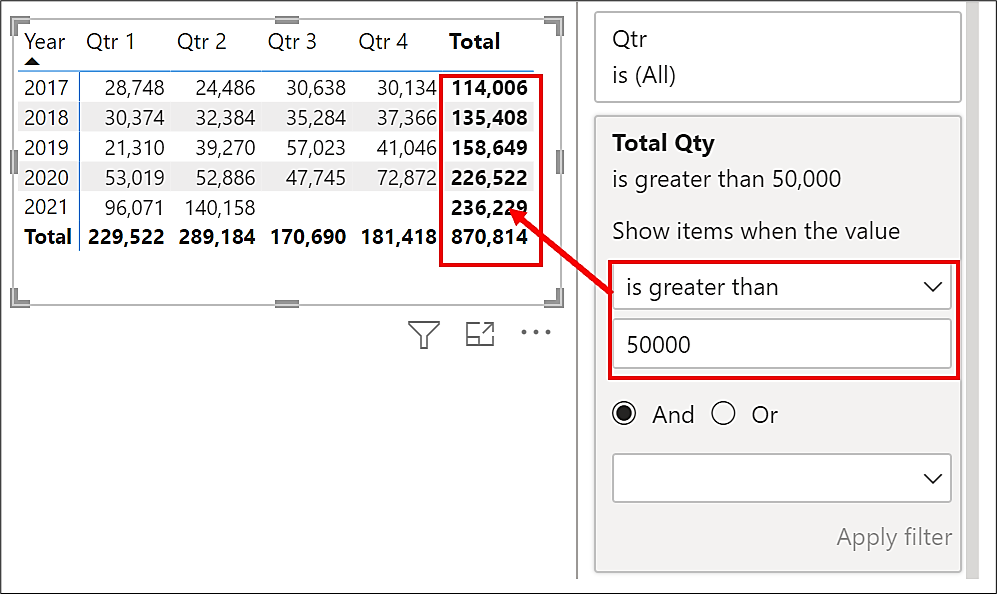
Although this may seem to most obvious reason to use a measure in a visual level filter, all is not plain sailing when you do this. For example, in the Matrix visual below, we have the “Year” and “Qtr” fields sitting in the “rows” of the matrix. We are using the “Total Qty” measure in the Visual Level filter card and filtering values that are greater than 50,000. This works fine all the while the values being filtered sit in the “rows” of the Matrix: -
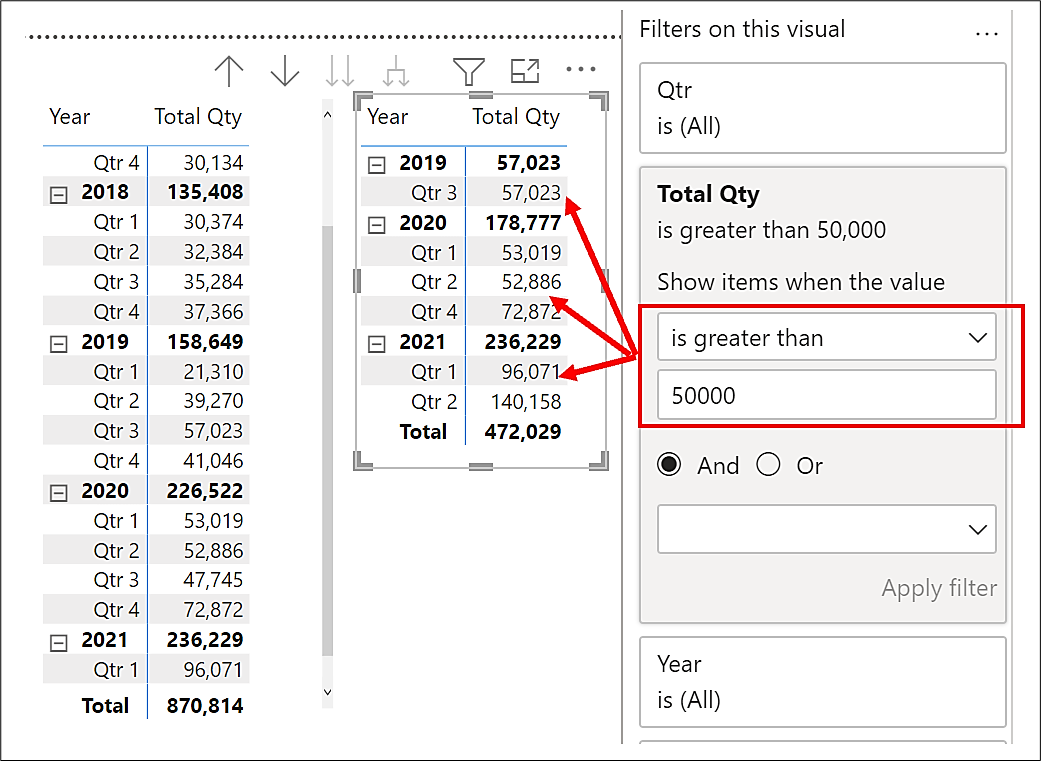
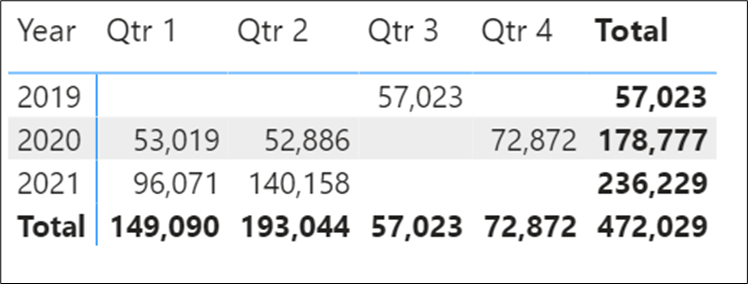
However, if we move the “Qtr” field onto the “columns” of the matrix, the filter appears to no longer work. In fact, the filter is working; it is filtering the Total values sitting in the Year “rows” of the Matrix.
Therefore, if we change the filter criterion to “greater than 150,000”, we can see the filter is correct:-

What we must understand from this scenario is that the Visual Level filter is only applied to values sitting in the “rows” of a matrix visual, not to values sitting in the “columns”
The question then that now remains is; how can we filter quantities greater than 50,000 that will work when we use the “columns” bucket of a Matrix visual. For this, we can’t use the Filters pane but must use DAX instead. This would be the measure that would filter our data accordingly: -
Filtered Qty =
SUMX (
FILTER (
SUMMARIZE ( DateTable, DateTable[Year], DateTable[Qtr] ),
[Total Qty] > 50000
),
[Total Qty]
)
If we put this measure into the “values” bucket of the matrix, we now have the correct filtered values.
But of course, we are now stuck having the analysed quantities greater than 50,000. We can’t browse the data by filtering by different quantities. To remedy this, you could create a parameter table that holds various filtering criteria: -
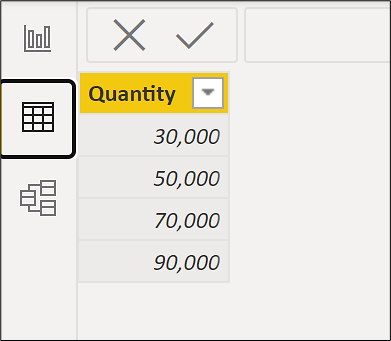
Parameter tables are not related to any other tables in the data model. You could then populate a slicer with the “Quantity” column from this table and simply edit the “Total Qty” measure as follows:
Filtered Qty =
VAR qtyvalue =
SELECTEDVALUE ( 'Fitering Values'[Quantity] )
RETURN
SUMX (
FILTER (
SUMMARIZE ( DateTable, DateTable[Year], DateTable[Qtr] ),
[Total Qty] > qtyvalue
),
[Total Qty]
)
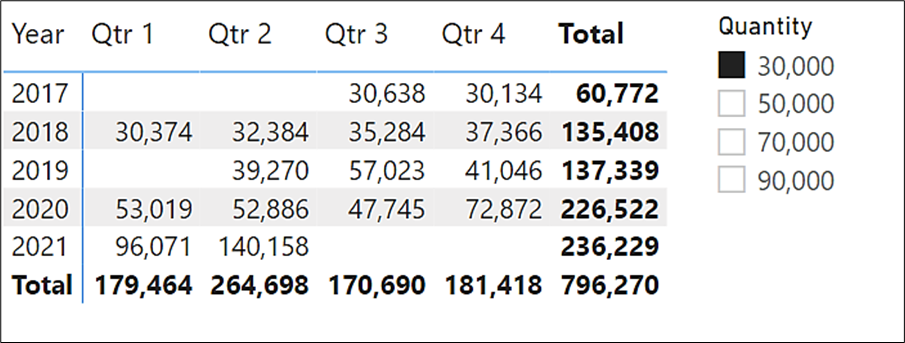
So now we are back to using Slicers to filter data, rather than the visual level filter!
Add new comment