The New On-Object Interaction (preview) – wave goodbye to your comfort zone

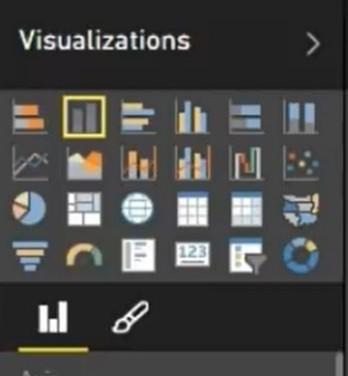
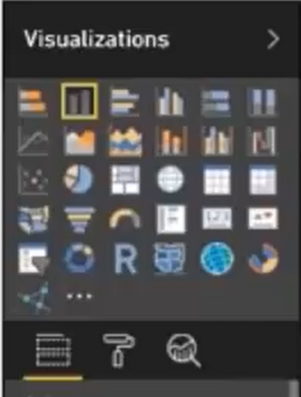
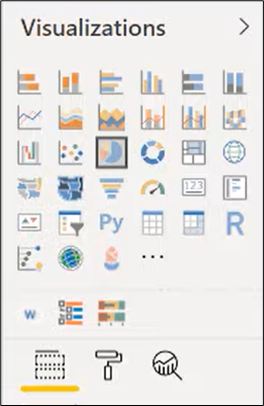
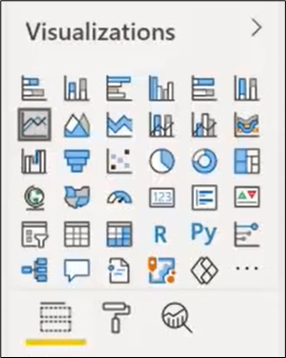
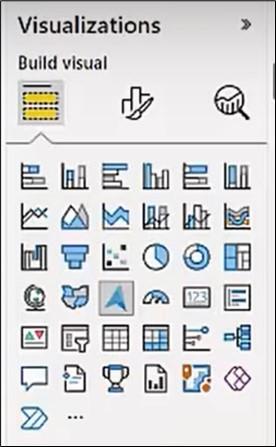
Since Power BI’s introduction in 2015, the Visualizations pane has had quite a few makeovers:
|
Image
|
Image
|
Image
|
|
Image
|
|
Image
|
But all these changes have been primarily cosmetic or involved moving the same elements to different locations. I particularly like the way we started out with a paintbrush to signify formatting options, moved to a paint roller and most recently are back with the paintbrush!
However, we mustn’t get too attached to the Visualizations pane because, with the new Desktop UI (currently in preview), it has been relegated to the annals of history. It is no more and has gone the way of the dodo. And it’s time for us to move out of our comfort zone.
Welcome to the new “on-object interaction” which has necessitated a complete re-evaluation of the way we go about things when we build our reports. It’s a fresh approach which allows you to construct and style visuals directly on the visual’s placeholder. It does this by placing the frequently used functions for visual creation and formatting that were found on the old Visualizations pane right on the visuals themselves.
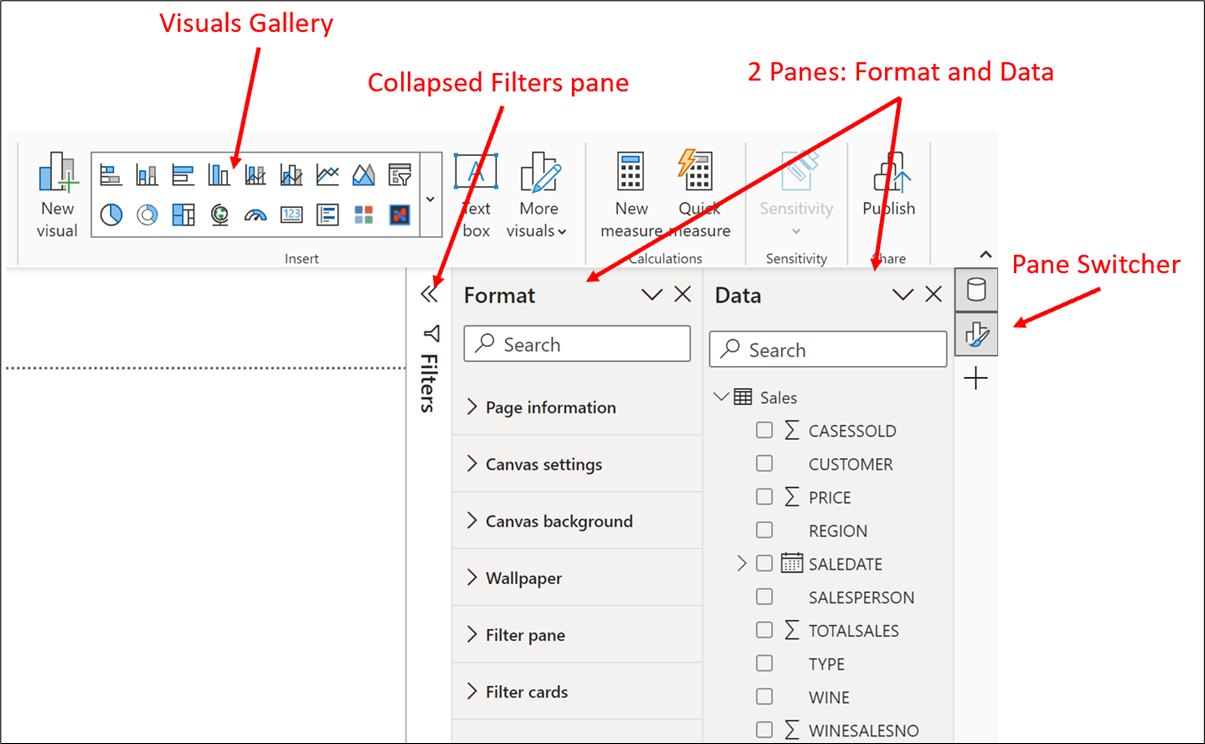
Let’s now explore the changes we will meet. When you first open a new power BI desktop file with the on-object interaction enabled and load your data, you will notice the following:-
-
· There is no longer a Visualizations pane
-
· The Visuals Gallery is now on the Home tab in the Insert group and also on the Insert tab
-
· There are two panes showing on the right: Format and Data
-
· There is a new Pane Switcher panel to the far right
-
· The Filters pane is collapsed.
Image
Building a Visual
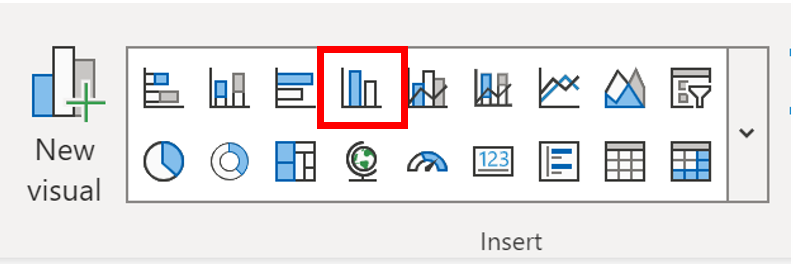
Select your visual from the Visuals gallery on the Home or Insert tabs:-
Image
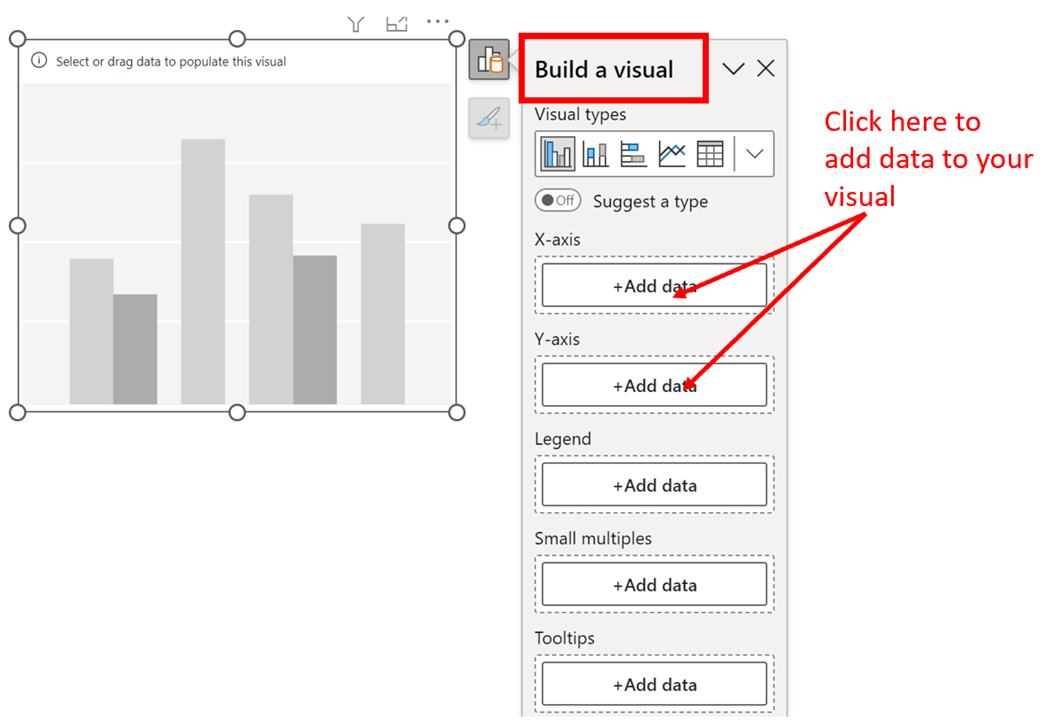
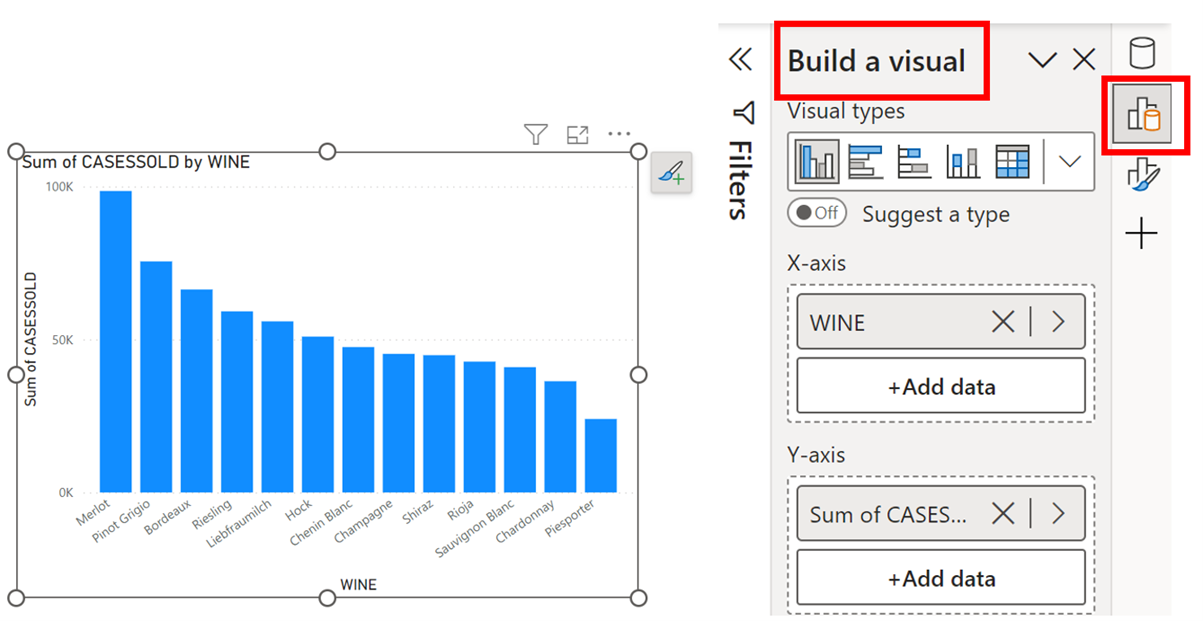
The placeholder for the visual appears on the canvas with the Build a visual pane showing to the right. To add fields to the visual, click into the buckets e.g. the X-axis bucket. The list of data (as on the Data pane) is displayed from which you can click on a field to place it into the bucket.
Image
The Filters pane expands by default on the creation of a visual. You can collapse this pane if you are not using it.
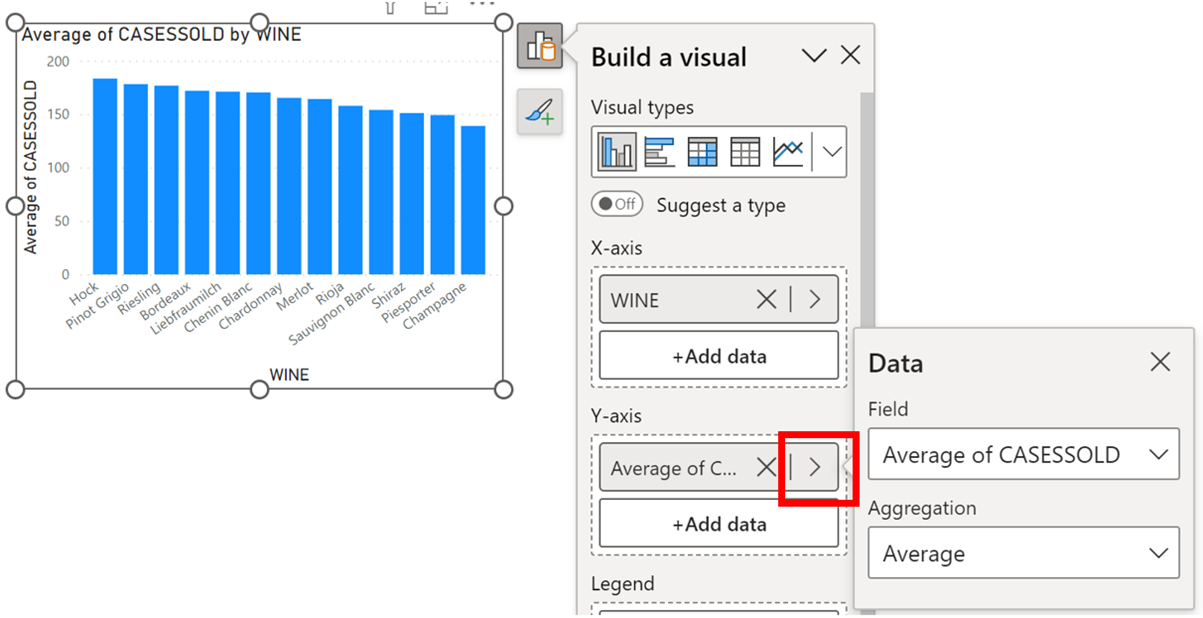
If you want the visual to show a different calculation, click on the right-pointing arrow to the right of the field in the bucket:
Image
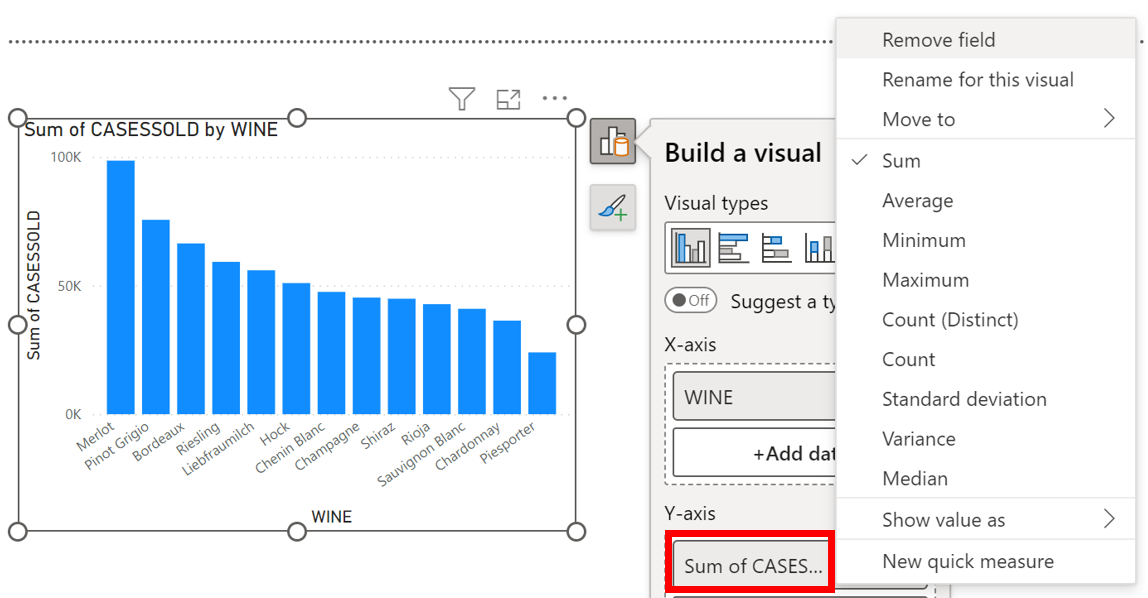
Or you can right click on the field in a bucket to select from different aggregate functions and other options:
Image
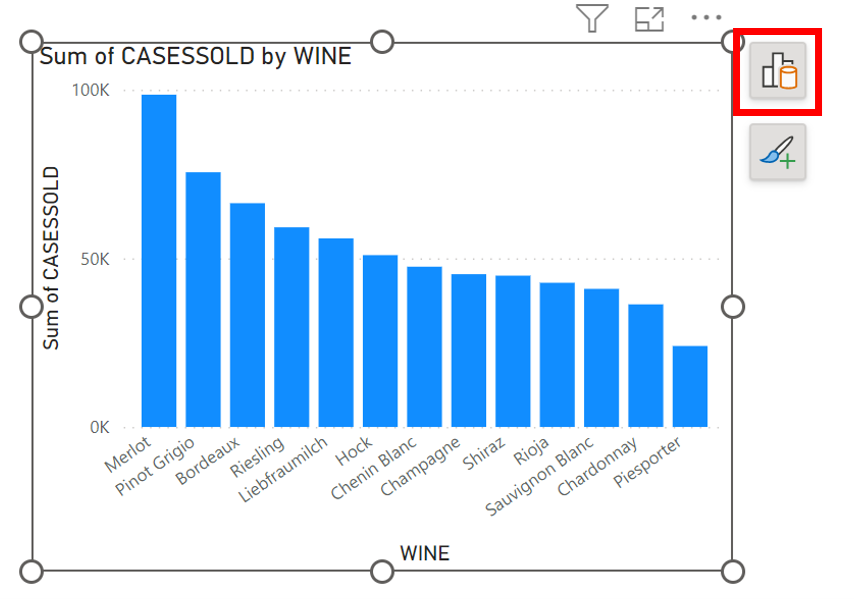
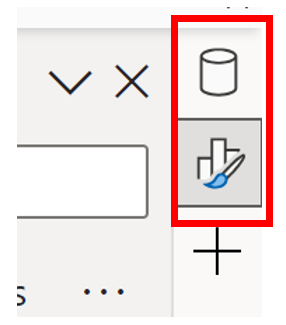
The Build a visual pane is controlled by the button to the top right (or left) of the visual’s placeholder:-
Image
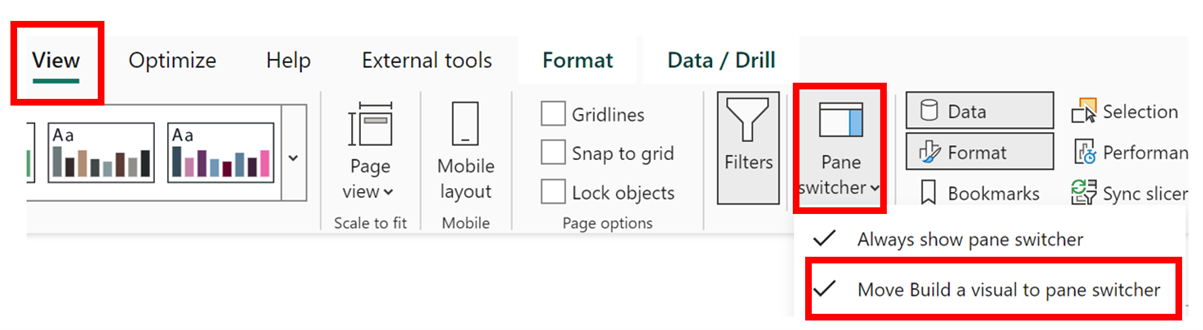
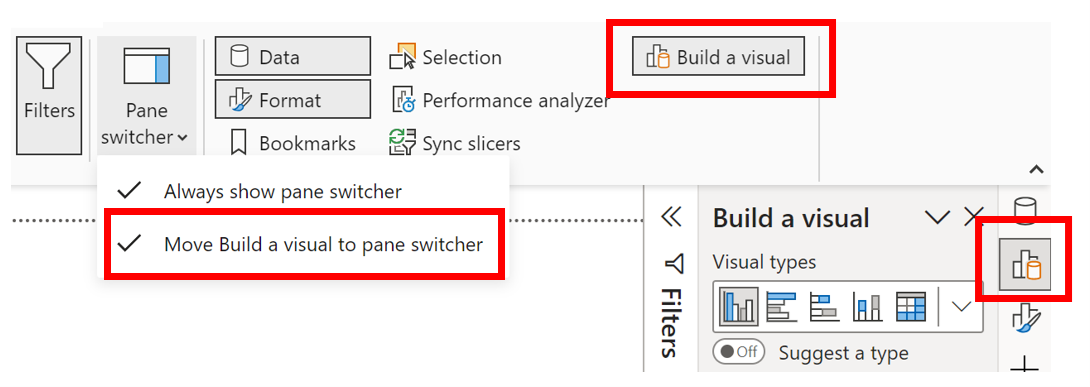
If you prefer to dock the Build a visual pane on the right of the screen where the other panes show, on the View tab, using the Pane switcher button, select “Move Build a visual to the pane switcher”:
Image
The Build a visual pane now is positioned on the right of the screen with its button now in the pane switcher:-
Image
To convert one visual to another, select the alternative visual from the Visual types on the Build a visual pane or select from the Visuals gallery on the View tab.
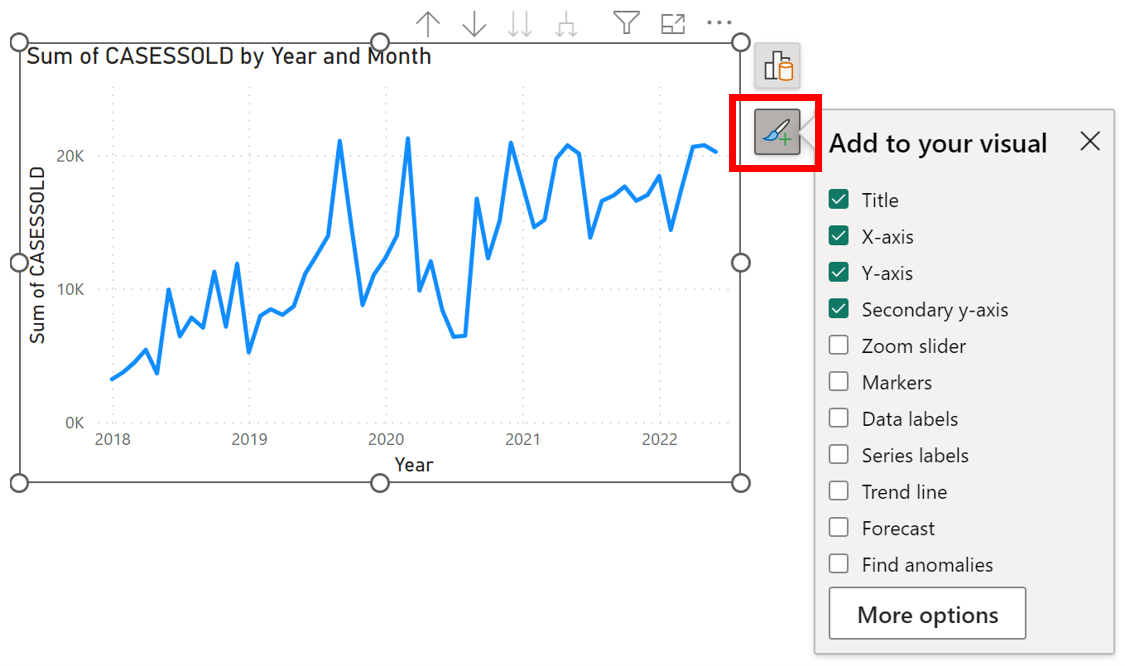
To add and remove visual elements, click on the Add elements button below the Build a visual button to display the Add to your visual pane:
Image
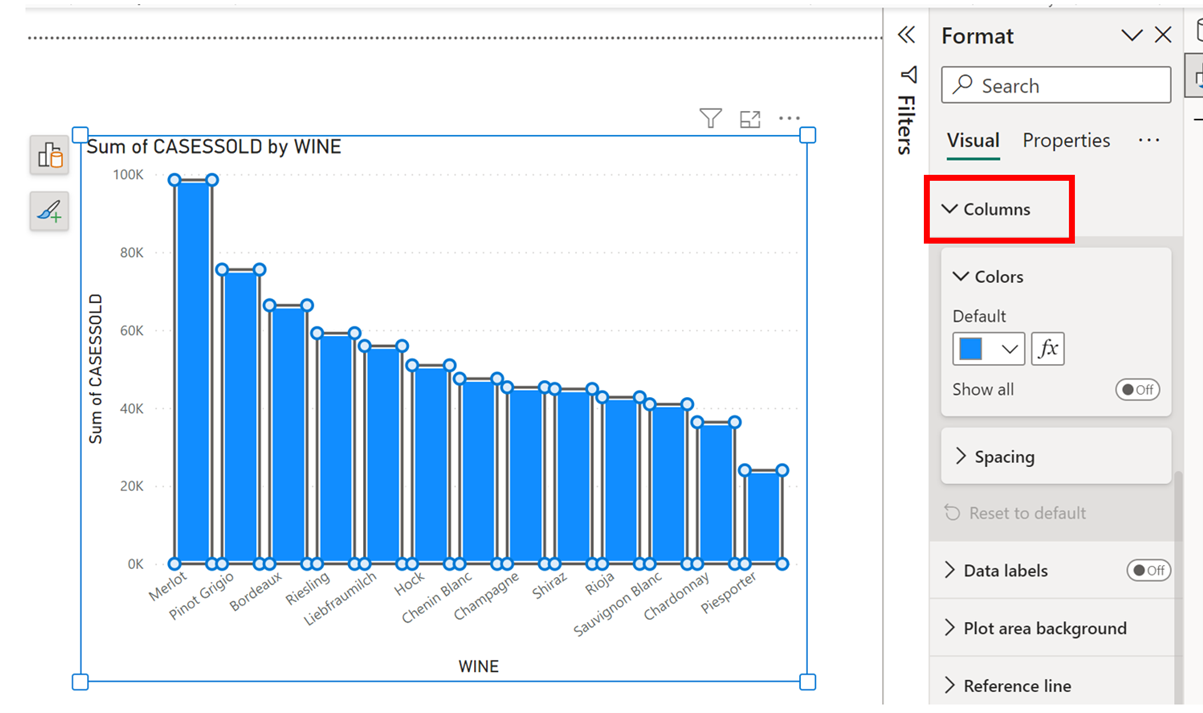
Format a Visual
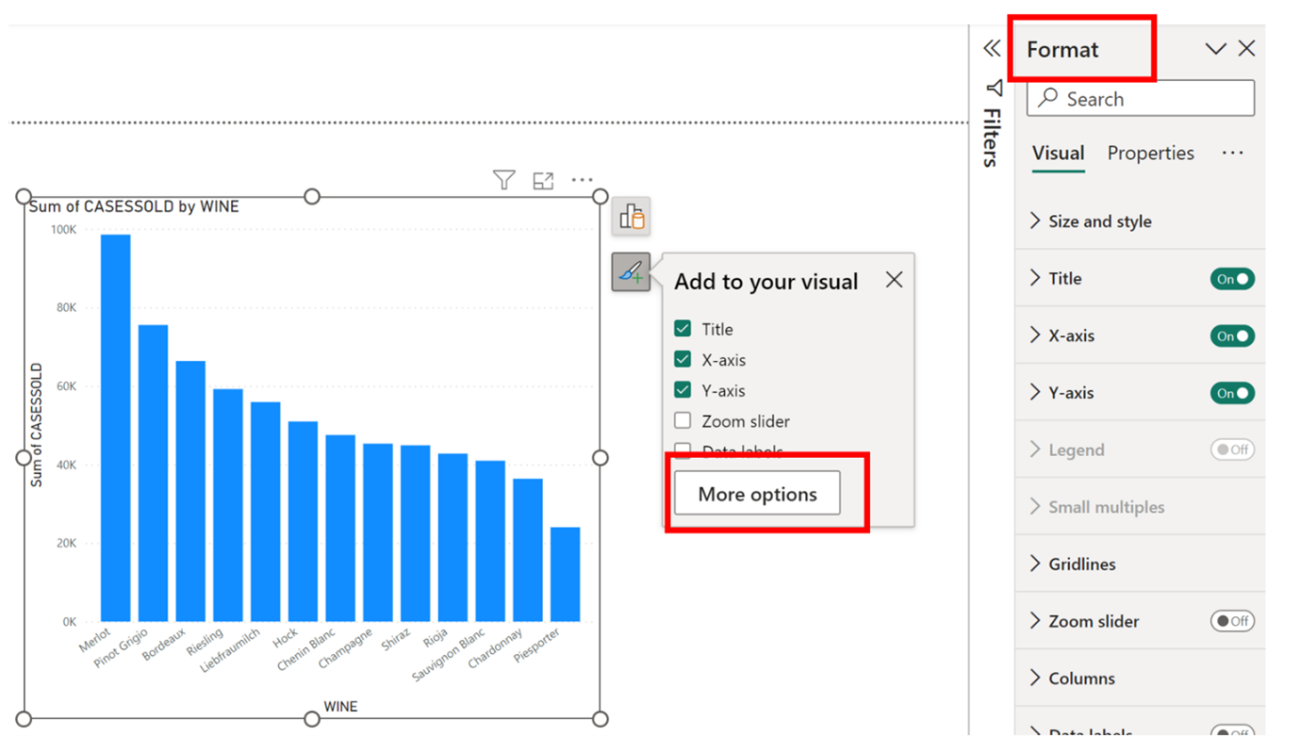
With a visual selected, the Format pane shows by default on the right of the screen. If you have turned off the Format pane, you can show it again by clicking on the More options button at the bottom of the Add to your visual pane:-
Image
An alternative method of formatting a visual is to use format mode by double clicking into the visual or right clicking into the visual and selecting “Format” from the short cut menu. When you are in format mode, the visual’s placeholder will have a blue border with square handles on each corner. When in format mode, to format an element of the visual, click onto it, e.g the columns of a column chart, and the formatting options for that element will show in the Format pane:
Image
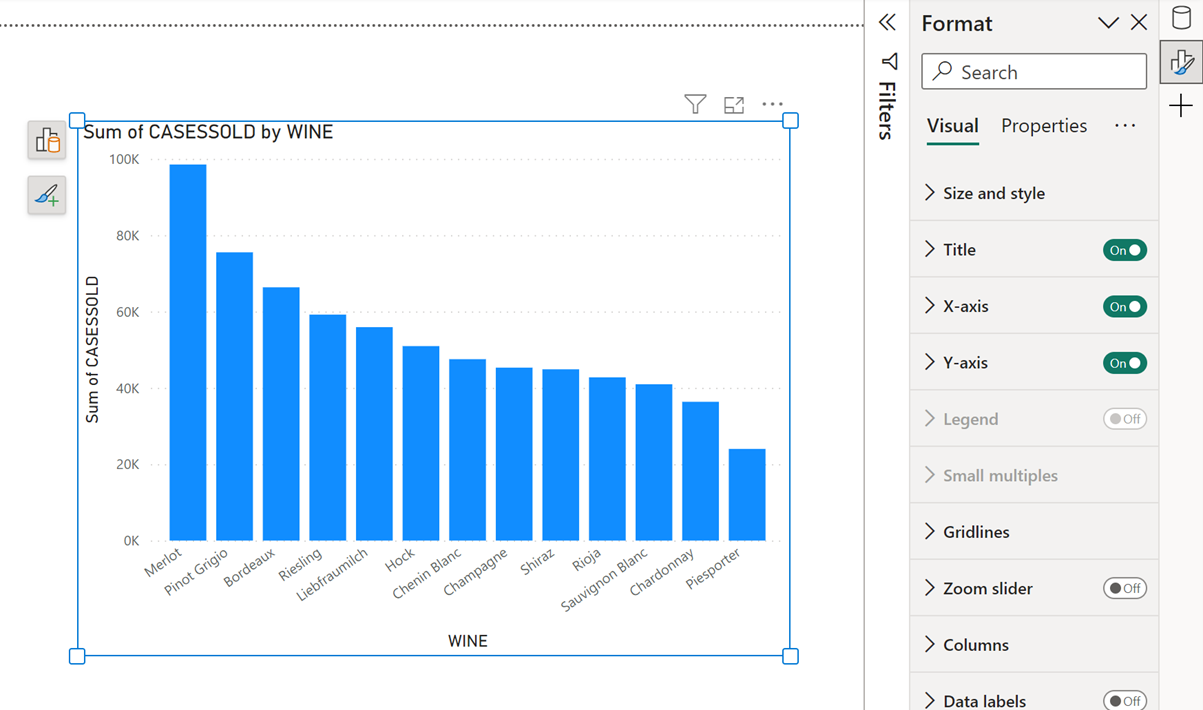
Image
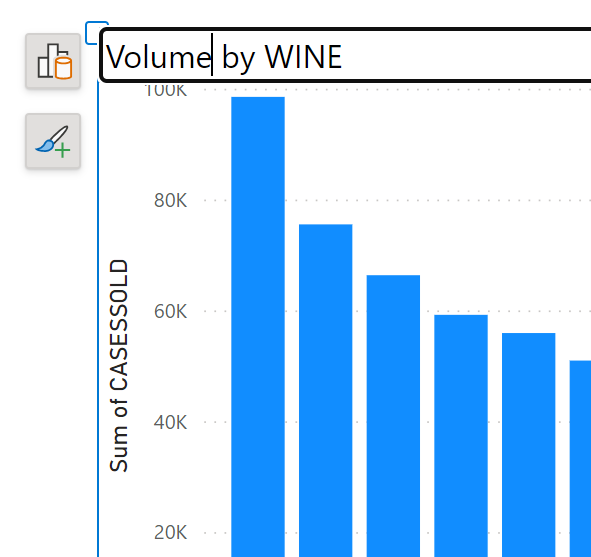
To edit text elements e.g. the Visual title or axes titles, simply double click into them while in format mode:
Image
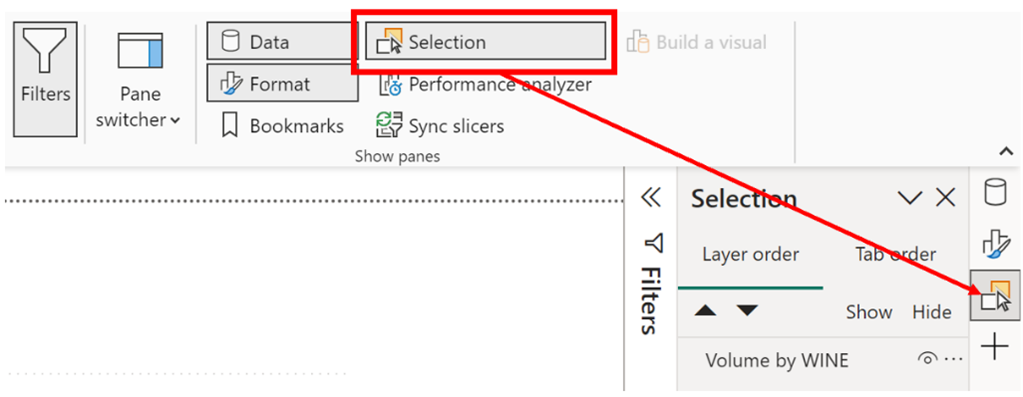
Controlling Panes
The pane switcher allows you to toggle between different panes. By default, only the Format and Data panes show in the pane switcher. However, on the View tab, in the Show panes group, you can click on the name of a pane to add it to the pane switcher:-
Image
Image
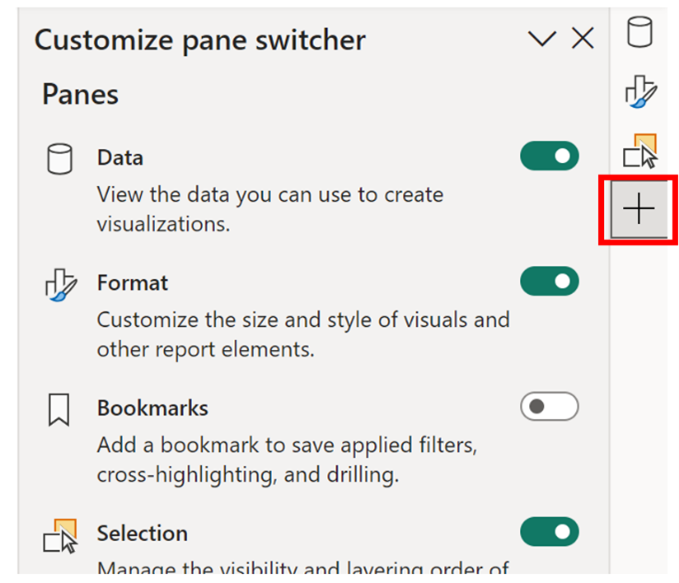
An alternative way to add panes to the pane switcher is to use the plus button at the bottom of the pane switcher to show the “Customize pane switcher” options:
Image
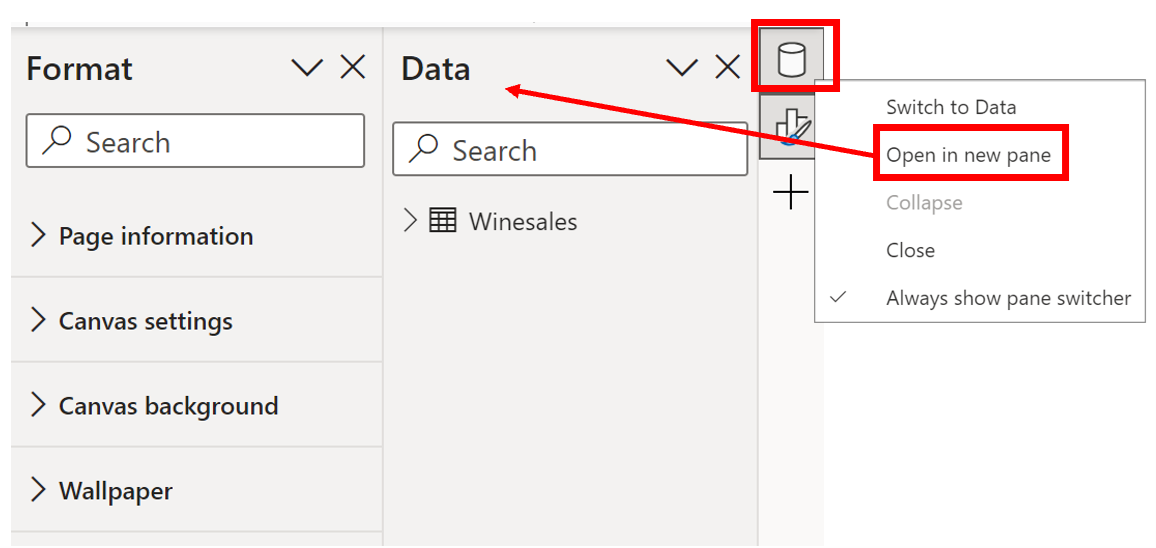
To have more than one pane showing at a time, right click on a button in the pane switcher and select “Open in new pane”. Alternative, hold down the CTRL key as you click on buttons in the pane switcher:
Image
If you have selected to move the Build a visual pane to the pane switcher, the button for this pane is enabled on the View tab and is added to the pane switcher:-
Image
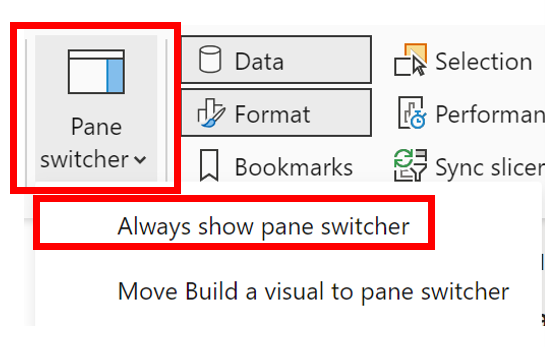
If you turn off all panes, the pane switcher will remain by default on the right of the screen, with just the plus button showing. If you want to remove the pane switcher altogether, on the View tab and on the Pane switcher button, turn off “Always show pane switcher”:
Image
Now if you remove all panes, only the Filters pane will show on the right of the screen (if you have not closed it).
The New Format Pane
The new format pane is divided into two categories: Visual and Properties:
Image
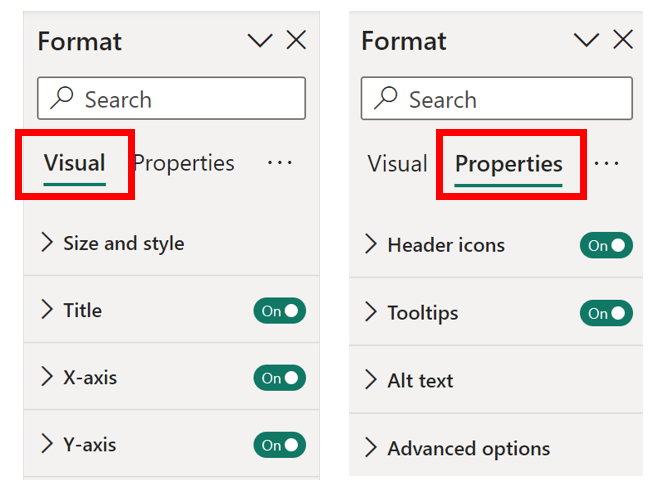
On the Visual category, are all the formatting options specific to the visual you are formatting. On the Properties category are the options for the Header icons, Tooltips (if supported), Alt text and Advanced options.
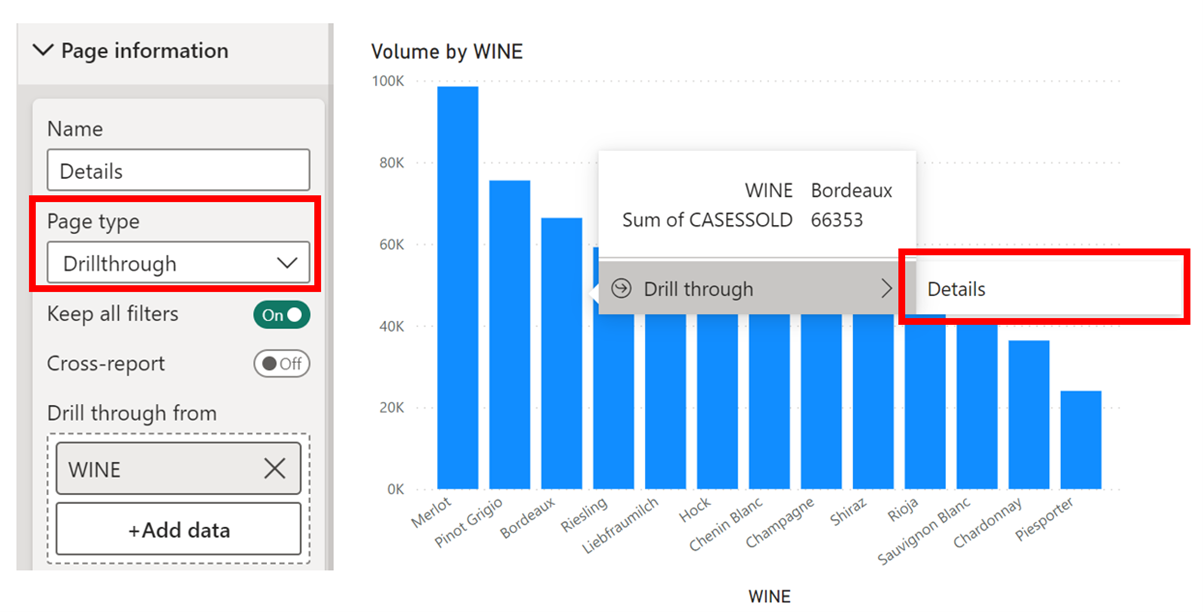
Drillthrough Page
The drillthrough page options are now under the Page Information formatting options. These formatting options show if you have no visual selected. For example, you may want to drillthrough to a page called “Details” so on the “Details” page, in the Page information options, you would select “Drillthrough” as the Page type and then populate the Drill through from bucket with the relevant category. The drill through option is then available on the tooltip when you hover over that category in a visual that sits on another page:
Image
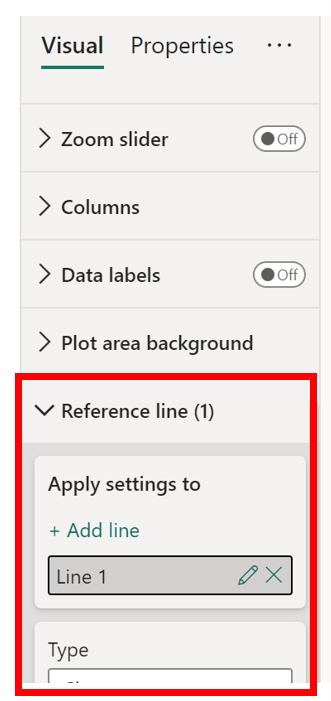
Analytics Lines
These are now called “Reference lines” and are found on the Visual category of the Format pane:-
Image
Add new comment