Total Row Grief – When Your Measures Don’t Sum in the Total Row
On the Microsoft Power BI Ideas Forum (https://ideas.powerbi.com/ideas/), there is a long-running request (since July 2018) that has amassed a modest 341 votes to date. What is this request you ask? Here it is:-
“It would be great if Grand Totals on a Matrix or Table would add up correctly to the sum of the rows when you include MEASURES in the visual. Currently, the total on a measure consists of the measure function itself, instead of the sum of the rows above. PLEASE give us the option to toggle totals to be a simple aggregate of the rows above also.”
Personally, I won’t be voting for this option because I believe if measures always summed the rows above, it would lead to ambiguity and therefore confusion as to what exactly the measures were calculating. Instead, what is required here is a firm grasp of filter context and to understand that measures are always calculated within a specific filter context that shouldn’t change just because the measure is being calculated in a different place in a matrix or table. The fact that people don’t understand the context of evaluations in total rows is not the fault of DAX.
A very simple solution is knowing how to ensure that measures show correct totals. All you need to do is create a measure that will aggregate your original measure correctly. Such a measure will require just two elements:-
1. Referencing a table (real or virtual) that holds the categorical columns in the Matrix or Table visual where the total row is being evaluated.
2. The SUMX function passed over this table to aggregate the original measure.
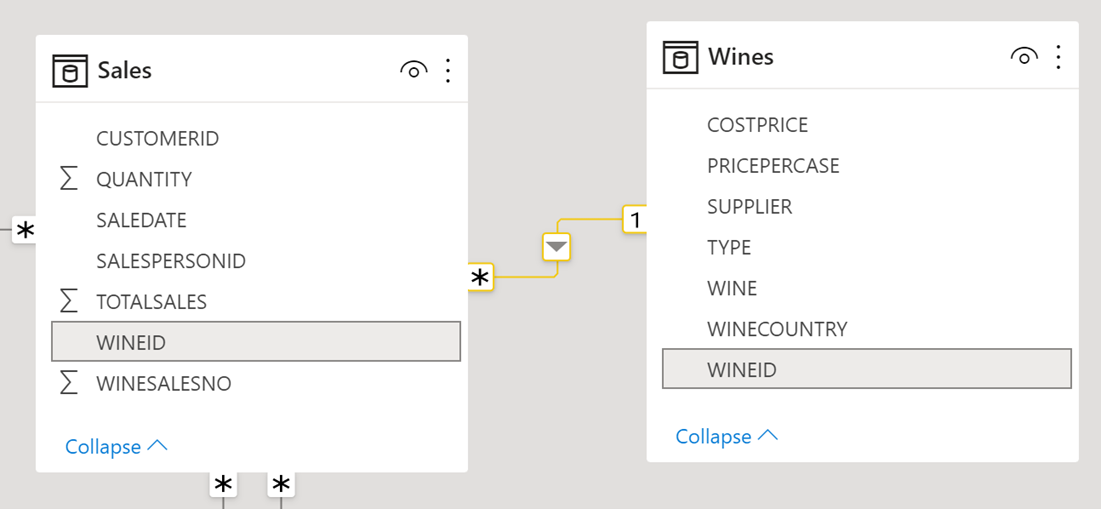
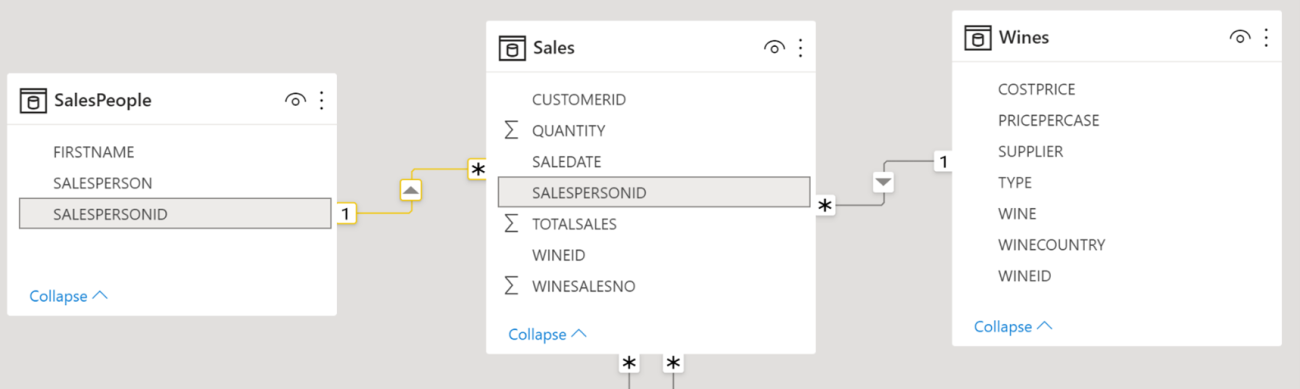
Let’s take an example of how this can work. In my data model, I have a Wines dimension related to a Sales fact table that holds a QUANTITY column:-
I have created these two measures:-
Total Qty = SUM ( Sales[QUANTITY] )
Total Qty Plus 100 = SUM ( Sales[QUANTITY] ) + 100
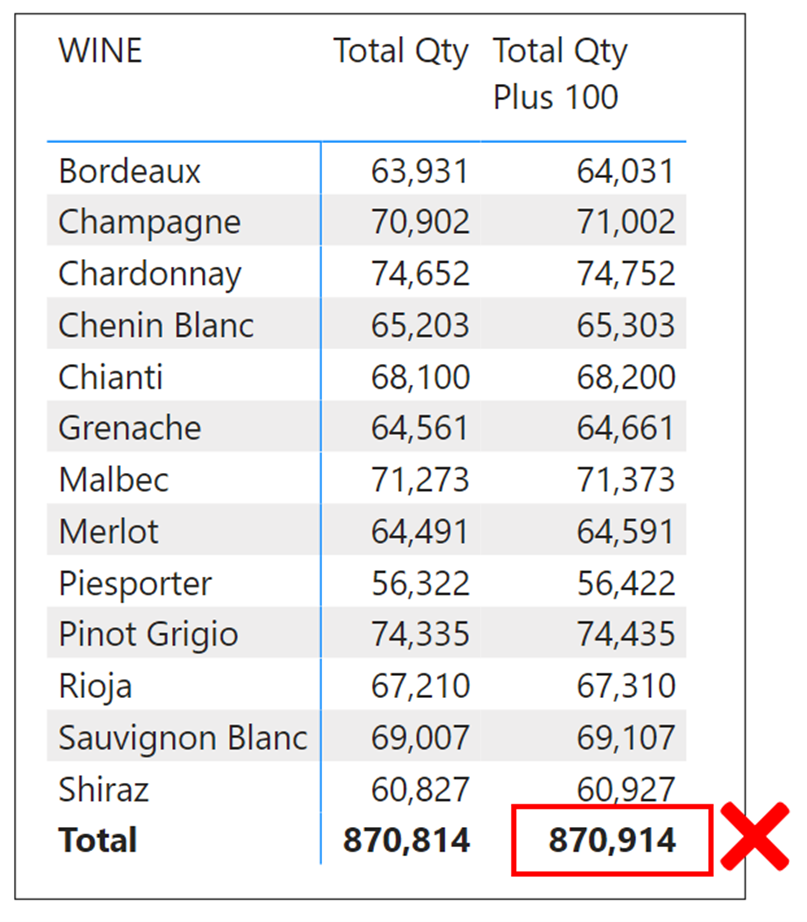
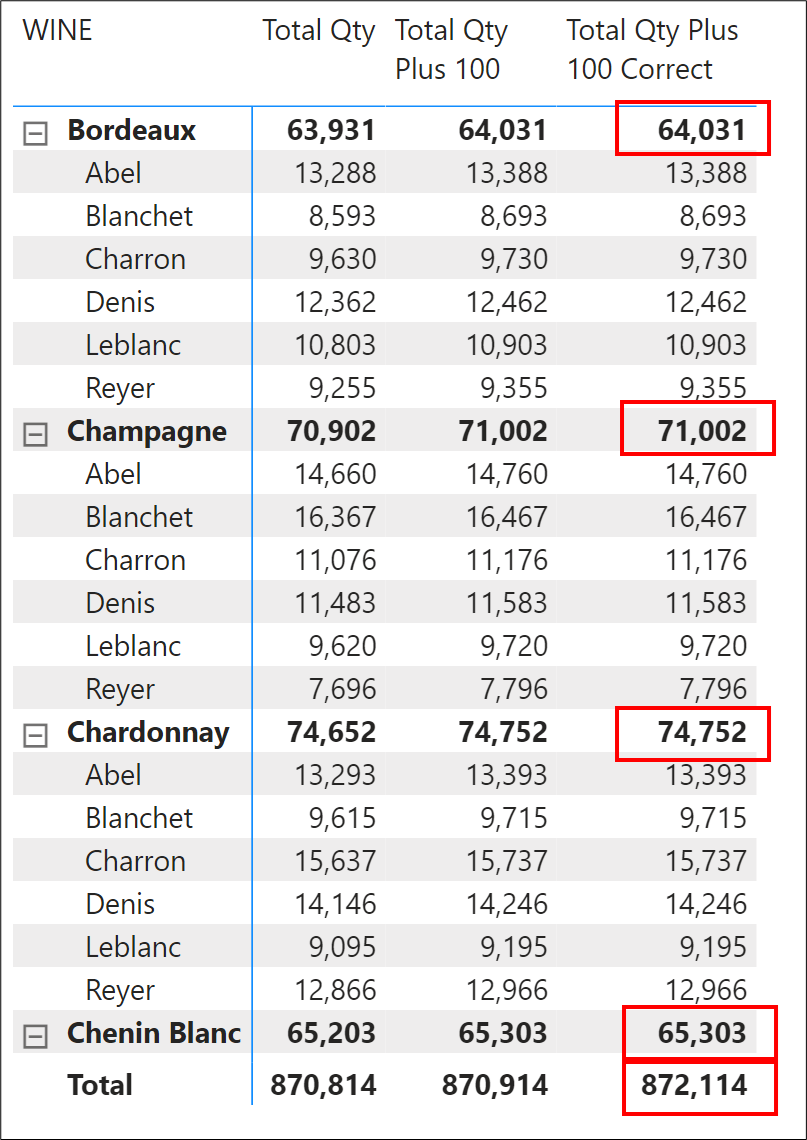
With the WINE column from the Wines dimension in a Table visual alongside these two measures, we can see that the “Total Qty Plus 100” measure is incorrect in the Total row:-
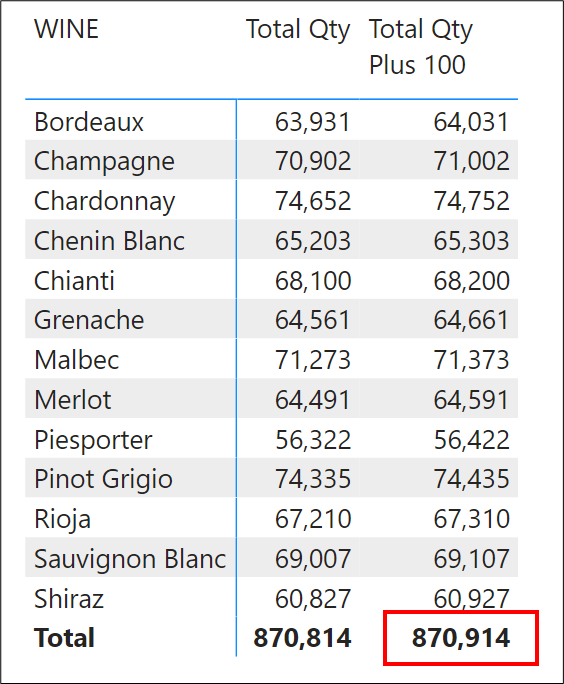
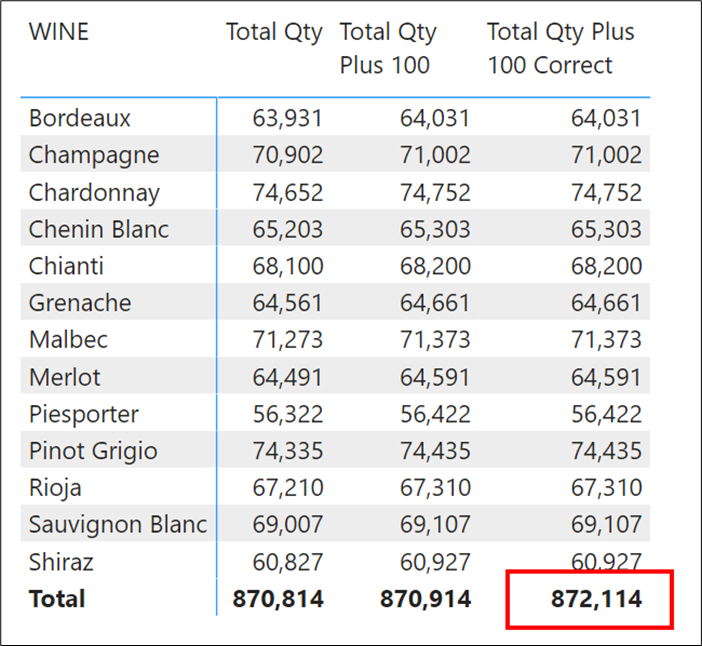
Clearly, what has happened here is that 100 has been added to the grand total of the sum of quantity, exactly according to the calculation of the measure. The way we can fix this is to create another measure that will aggregate our “Total Qty Plus 100” measure correctly. To do this, we can use the SUMX function to iterate the Wines table (because it will include the WINE column that is in the Table visual) and for every row in the Wines dimension, calculate the “Total Qty Plus 100”. When this measure evaluates for the Total row, filters are removed from the Wines dimension. Therefore, the measure will sum the individual results of “Total Qty Plus 100” for each wine, resulting in the correct total:-
Total Qty Plus 100 Correct =
SUMX ( wines, [Total Qty Plus 100] )
If I wanted to be more pedantic, because I only require the names of the wines sitting in the WINE column of the Wines dimension for SUMX to iterate, I could re-write the “Total Qty Plus 100 Correct” measure using the VALUES function to retrieve just the wine name values, rather than have to reference the entire Wines dimension.
Total Qty Plus 100 Correct =
SUMX ( VALUES ( Wines[WINE] ), [Total Qty Plus 100] )
The SUMMARIZE function would do the same job:-
Total Qty Plus 100 Correct =
SUMX ( SUMMARIZE ( Wines, Wines[WINE] ), [Total Qty Plus 100] )
Using SUMMARIZE in this way allows us to also build correct totals when the Matrix or Table visual holds columns from more than one table. For example, we have a SalesPeople dimension also related to our Sales fact table:-
If we now build a Matrix visual that includes the WINE column from the Wines dimension and the SALESPERSON column from the SalesPeople dimension, our “Total Qty Plus 100 Correct” measure will now not work:-
We need to ensure that the table that SUMX iterates includes both the WINE column and the SALESPERSON column, but these columns sit in different dimensions. If we use SUMMARIZE, we can build a virtual table that mimics the columns in the Rows of the Matrix and then pass SUMX over this virtual table:-
Total Qty Plus 100 Correct v2 =
SUMX (
SUMMARIZE ( Sales, Wines[WINE], SalesPeople[SALESPERSON] ),
[Total Qty Plus 100]
)
You can now understand that by using SUMMARIZE in this way, we can build virtual tables that combine columns from any dimensions, according to the structure of the Matrix or Table visual.
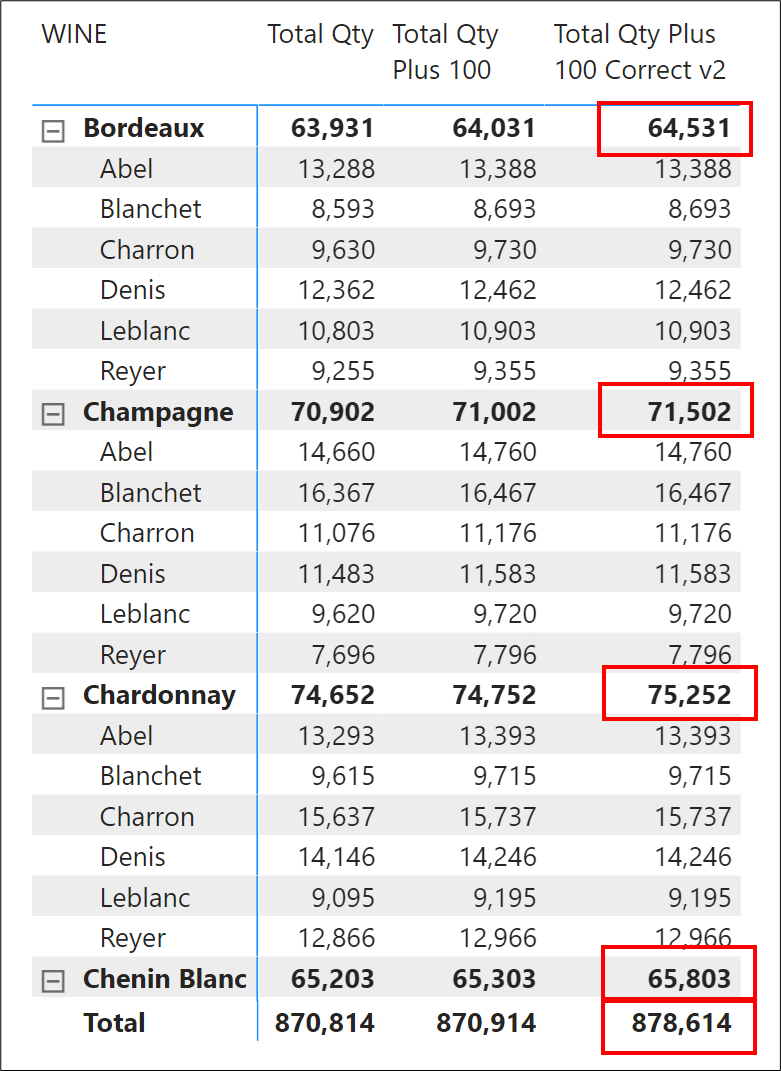
We now have the correct sub-totals and grand total:-
Therefore, knowing how to calculate correct totals using DAX means I don’t need any formatting option where I have to ask the Matrix or Table visual to do this for me.
Add new comment