Using Dynamic Values in the Smart Narrative and Text Box
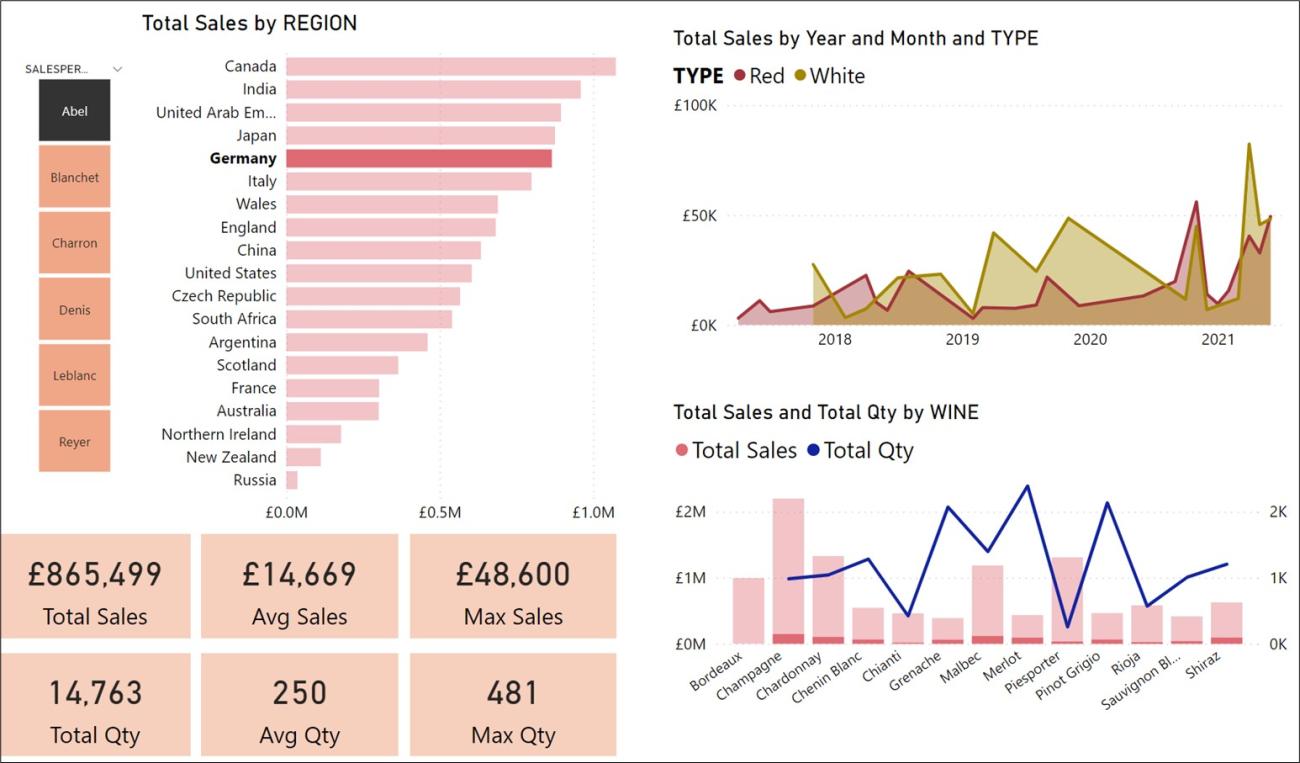
When you want to summarise key metrics in your report, the go-to visual you will probably use is the ubiquitous card visual. However, if you knew how to use dynamic values in the Smart Narrative Visual or Text box, there is an alternative approach from sticking a plethora of cards on the canvas. The problem with using cards is that you need a separate card for every metric you want to use in your summary. Take the example below, for example. Here, we are summarising sales for salesperson “Abel” for the region “Germany” in 6 separate cards at the bottom left of the canvas:
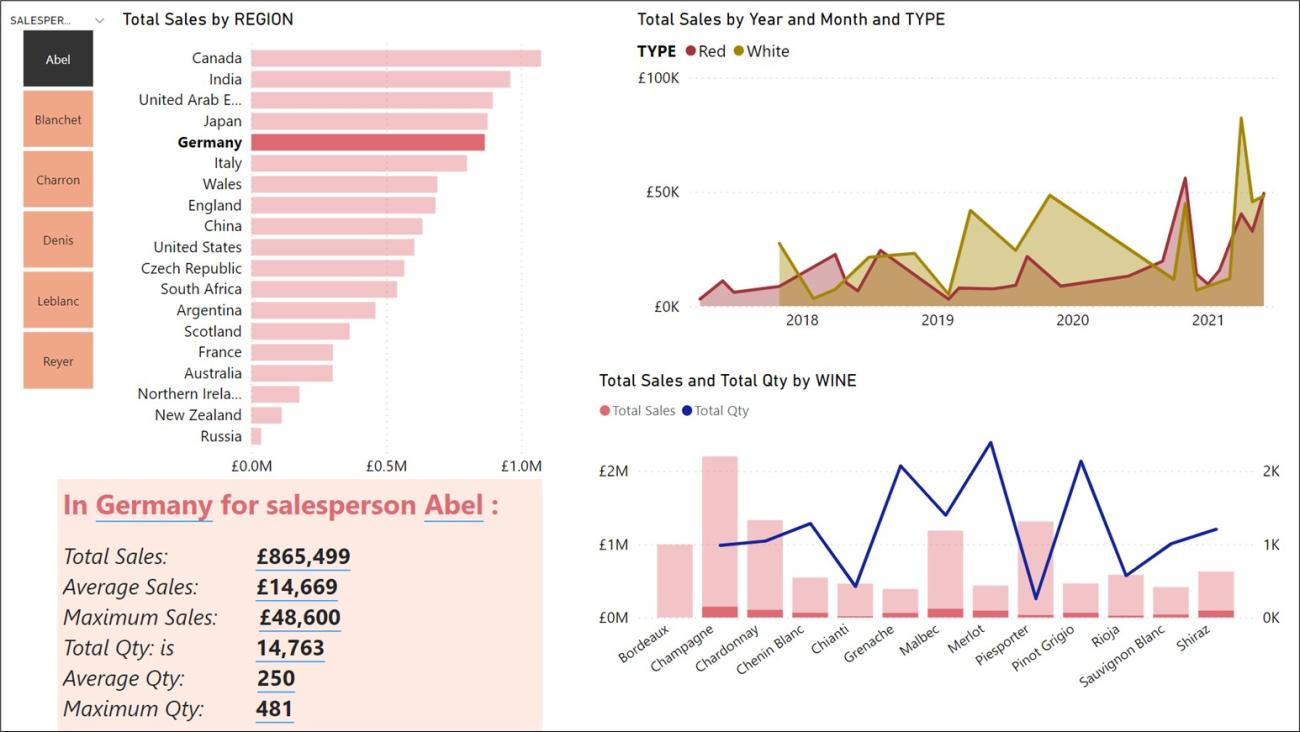
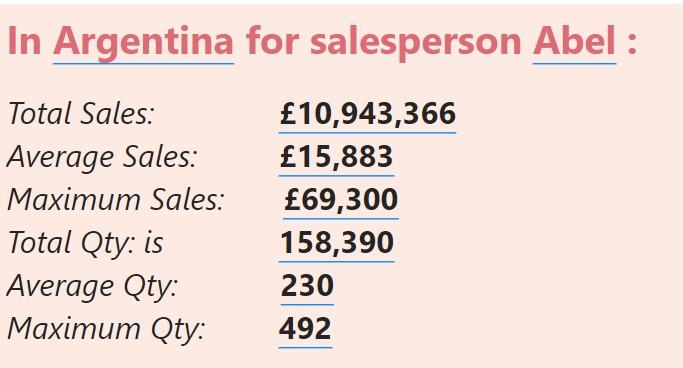
Whereas we could simply replace all 6 cards with one visual, as shown below. Welcome to the Smart Narrative visual a.k.a. the Text Box!
Although the Text Box and the Smart Narrative visuals are essentially the same thing, there is a difference. If you select the Smart Narrative visual from the Visualizations gallery,…
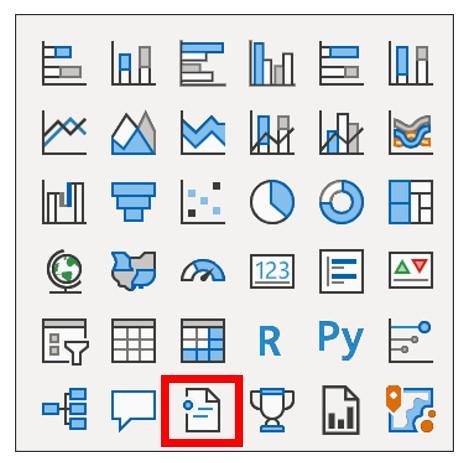
…Power BI will automatically summarise the data comprising the visuals on the page, whereas if you select a Text Box, you will need to generate the summary values yourself.
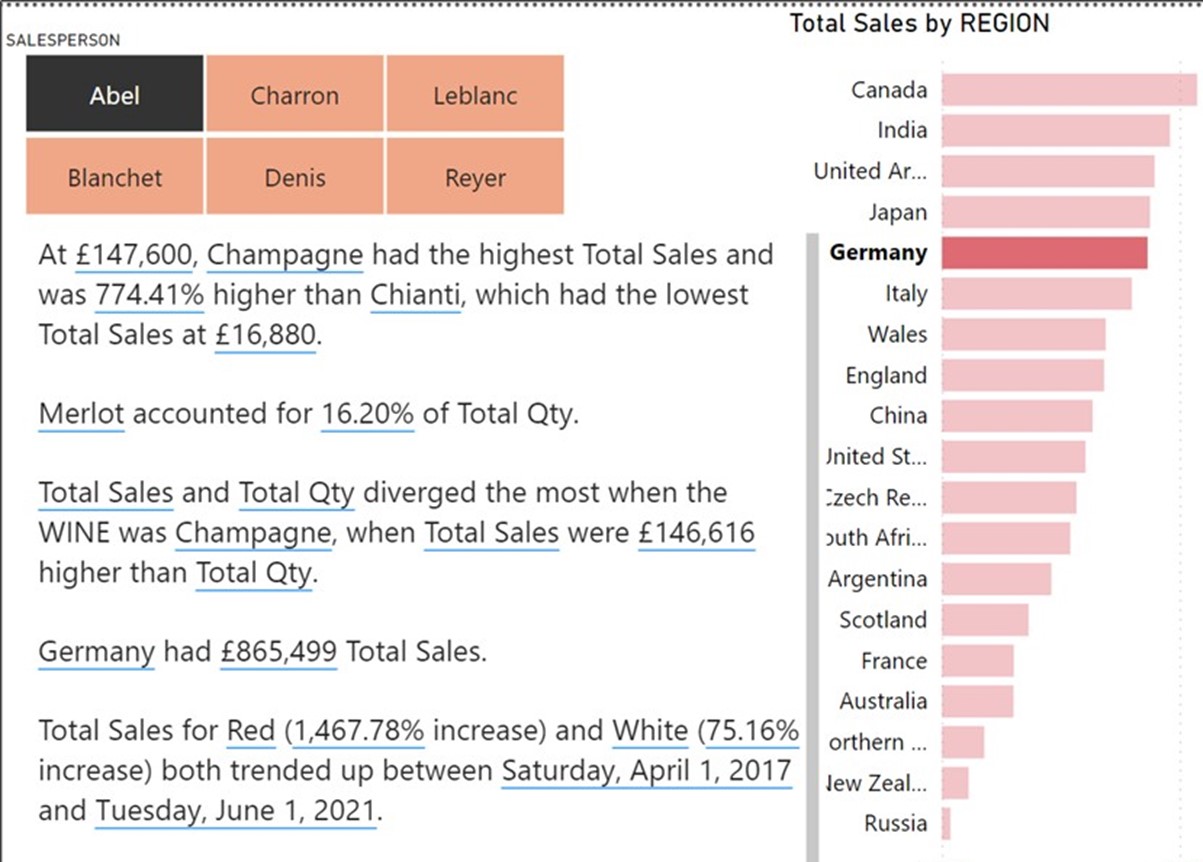
For example, if I insert a Smart Narrative visual onto my page, these are the summaries that the Smart Visual will generate: -
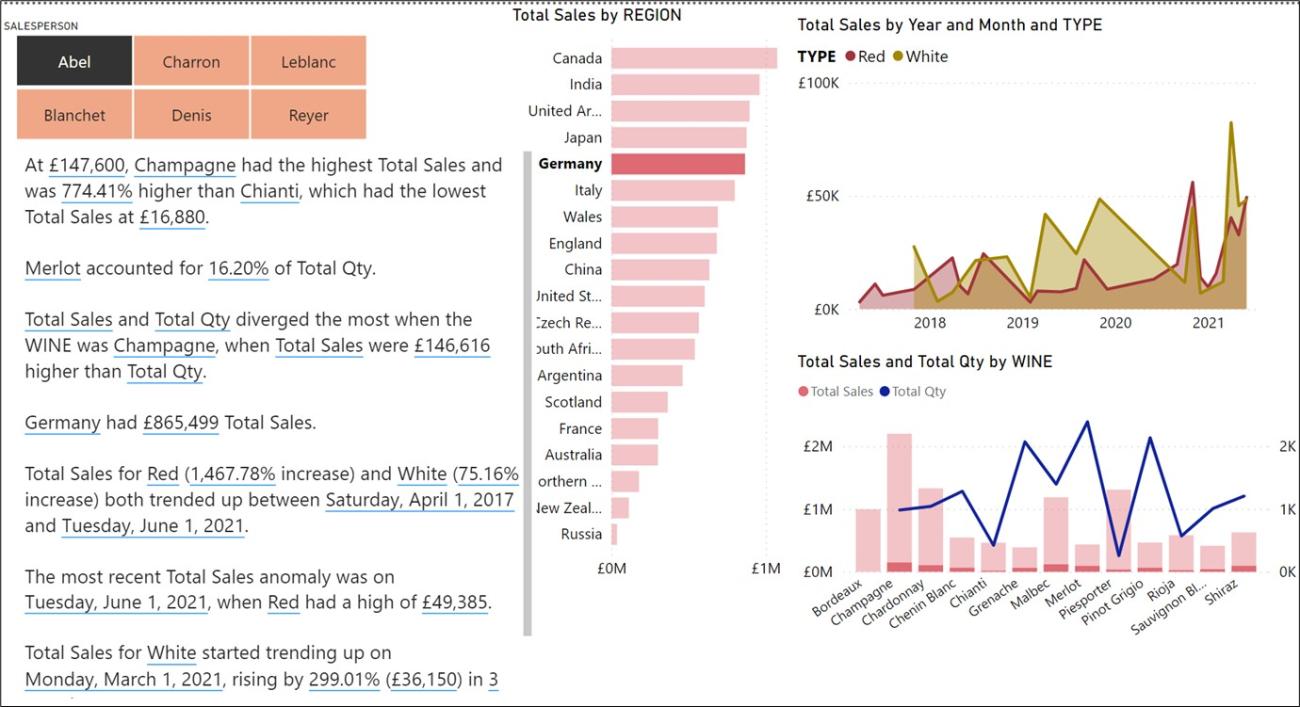
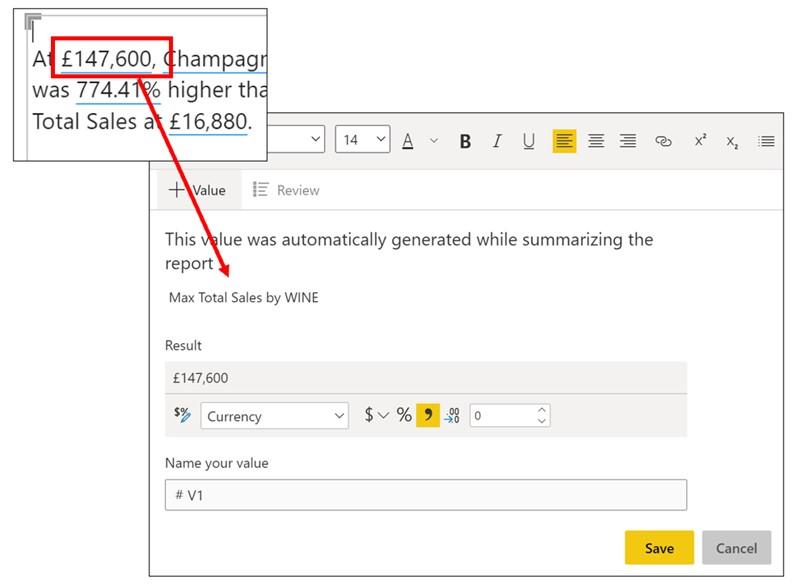
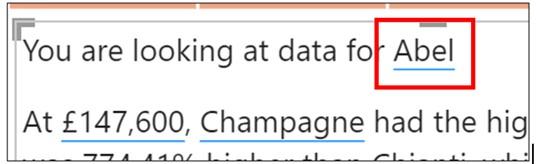
All the values with a blue underline (the underline doesn’t show when you publish) are dynamic values, generated by the visual. You can click on any of these values to see a description of them and format them if required.
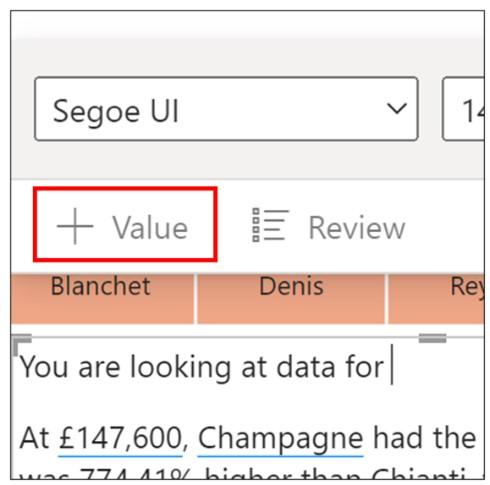
You can add your own dynamic values into the Smart Narrative. To do this, type the text you want and then to insert a value click on “Value” at the top of the visual:-
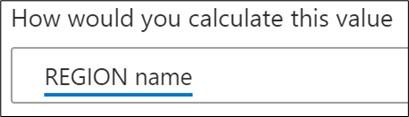
In “How would you calculate this value” type the value you want to insert. You can use natural language here, just as you would in Q&A.
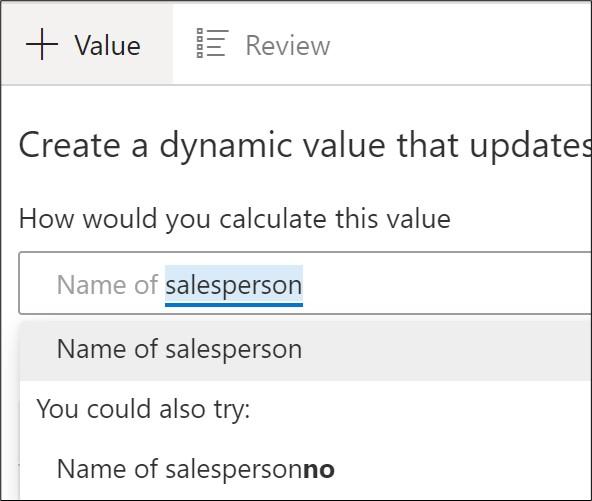
The blue line under any text you have typed indicates that the Smart Narrative has recognised the natural language you have used:-
Click Save to insert the value into the Smart Narrative.
Now you know how to add your own values to the Smart Narrative, you could instead just use a Text Box and build your own smart summaries.
By “smart” we mean that the summary values will change dynamically as you browse, slice and filter your report. Use the “Value” button at the top of the Text Box, to insert your dynamic values. In this example…
I typed this into the “How would you calculate this value” box to insert the Region name:
And to insert the Total Qty value, I typed this:-

If you don’t have existing measures that you want to use, you can ask the Smart Narrative to do the calculation for you. This is one of the great benefits of using these dynamic values, that you don’t always need to know how to do the DAX calculation!
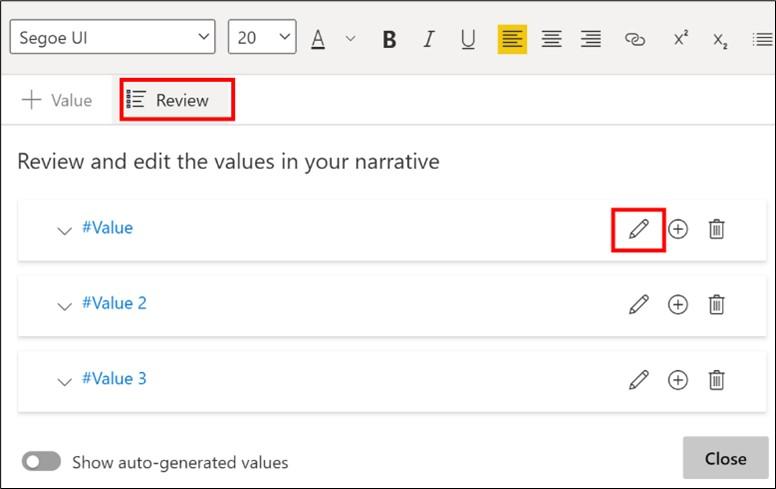
To edit a value, click on it and then use the “Review” button. Then click on the pen button.
The Smart Narrative and Text Box can make great alternatives to using multiple cards. However, we can take this one stage further because sometimes the Text Box is not an alternative to multiple card visuals but supplies a necessary narrative in its own right.
Take this example where we have filtered “Bordeaux” wine and a start and end range of transaction dates. We want to generative a narrative to explain whether the quantity has increased or decreased. We can do this using a Text Box with the dynamic values being supplied by either measures or by natural language.
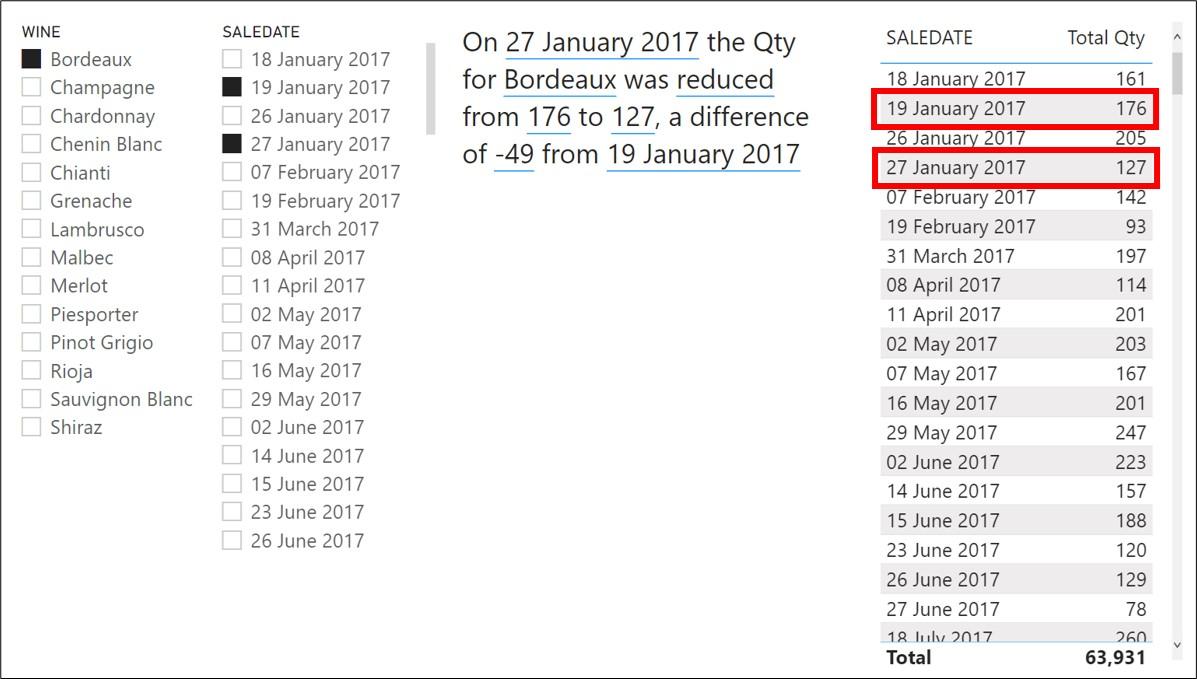
These are the measures I inserted into each “Value” of the Text Box, but I could also use natural language:-
On End Date = LASTDATE(SALES[SALEDATE]) or just type “last saledate”
the Qty for Wine Name = SELECTEDVALUE(WINESTABLE[WINE]) or just type “wine name”
was Up or Down = IF([Start Value] > [End Value],"reduced","increased")
from Start Value = CALCULATE(SUM(SALES[QUANTITY]), SALES[SALEDATE]=MIN((SALES[SALEDATE]))) or just type “first total qty”
to End Value = CALCULATE(SUM(SALES[QUANTITY]), SALES[SALEDATE]=MAX((SALES[SALEDATE]))) or just type “last total qty”
a difference of Difference = [End Value] - [Start Value]
from Start Date = FIRSTDATE(SALES[SALEDATE]) or just type “first saledate”
So next time you feel the urge to dump lots of cards on your report page, consider using a Text Box instead. But better still, why not generate your own smart narratives that can tell the story of your data that truly inform.
Add new comment