Visualising the Next or Previous N Months from a Selected Month
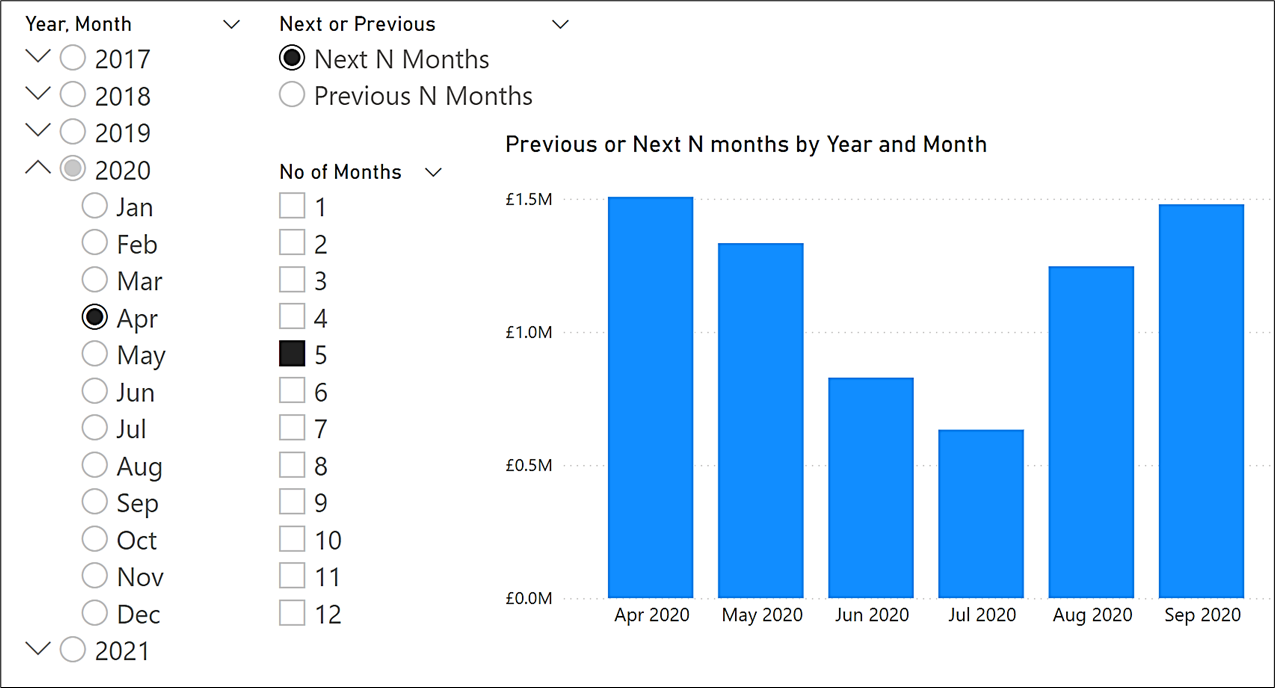
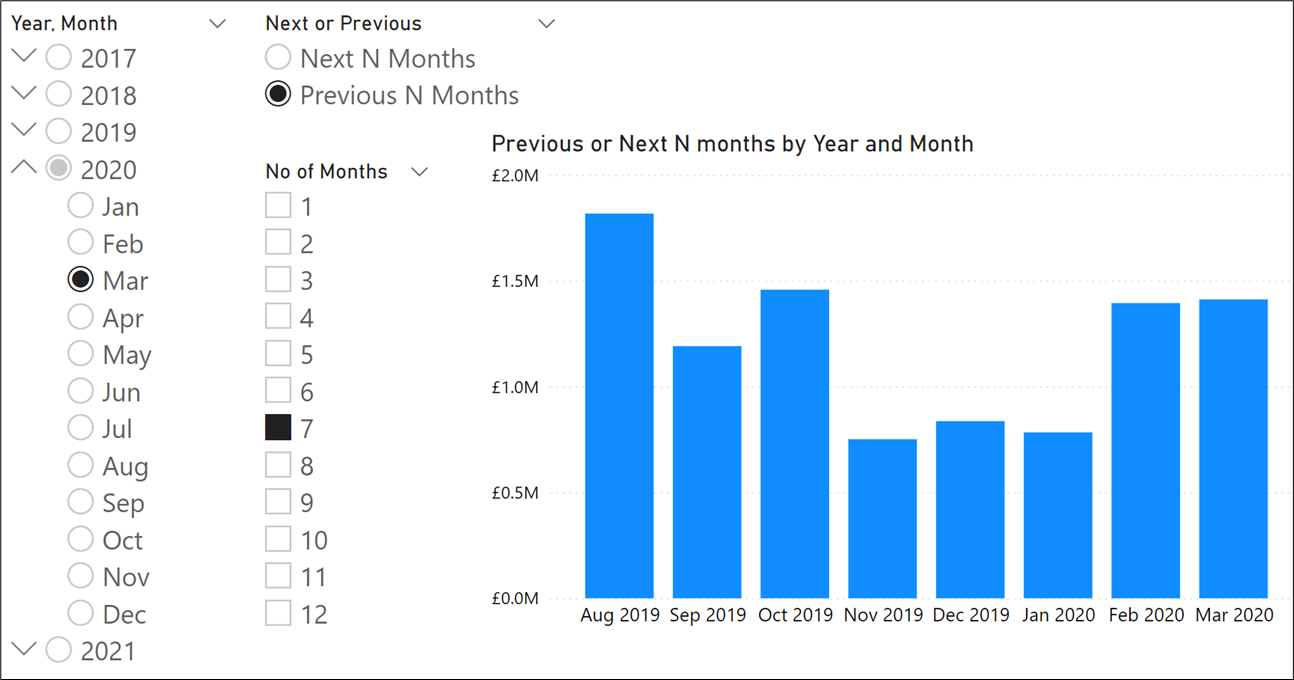
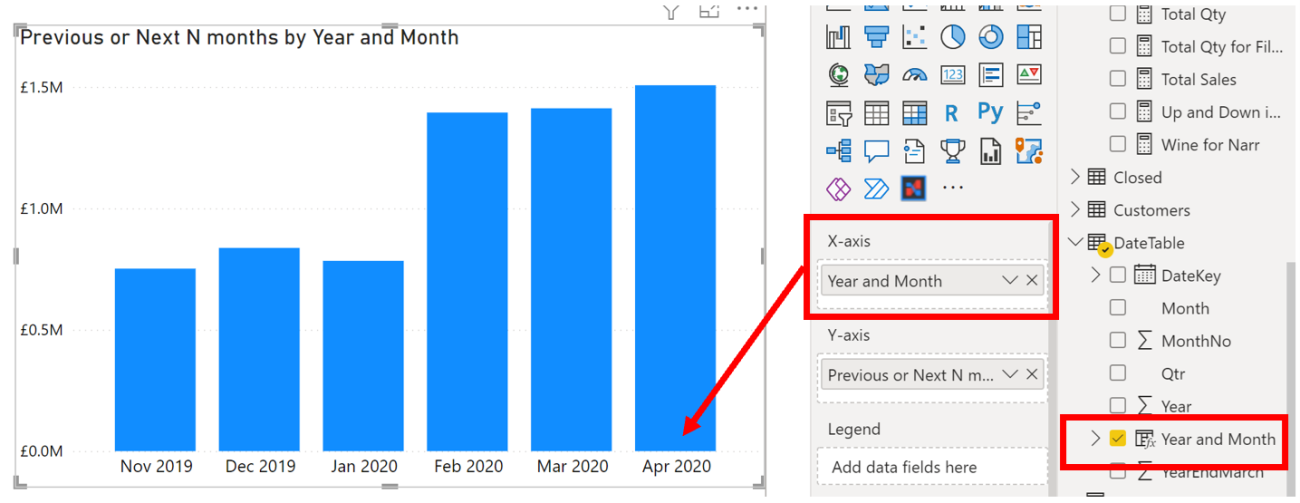
Ever wanted to do this? Select a month in a slicer and then visualise in a column chart the next 5 months’ sales from that date. Or show the previous 7 months’ sales:-
If the answer is yes, then read on and I’ll explain how it can be done.
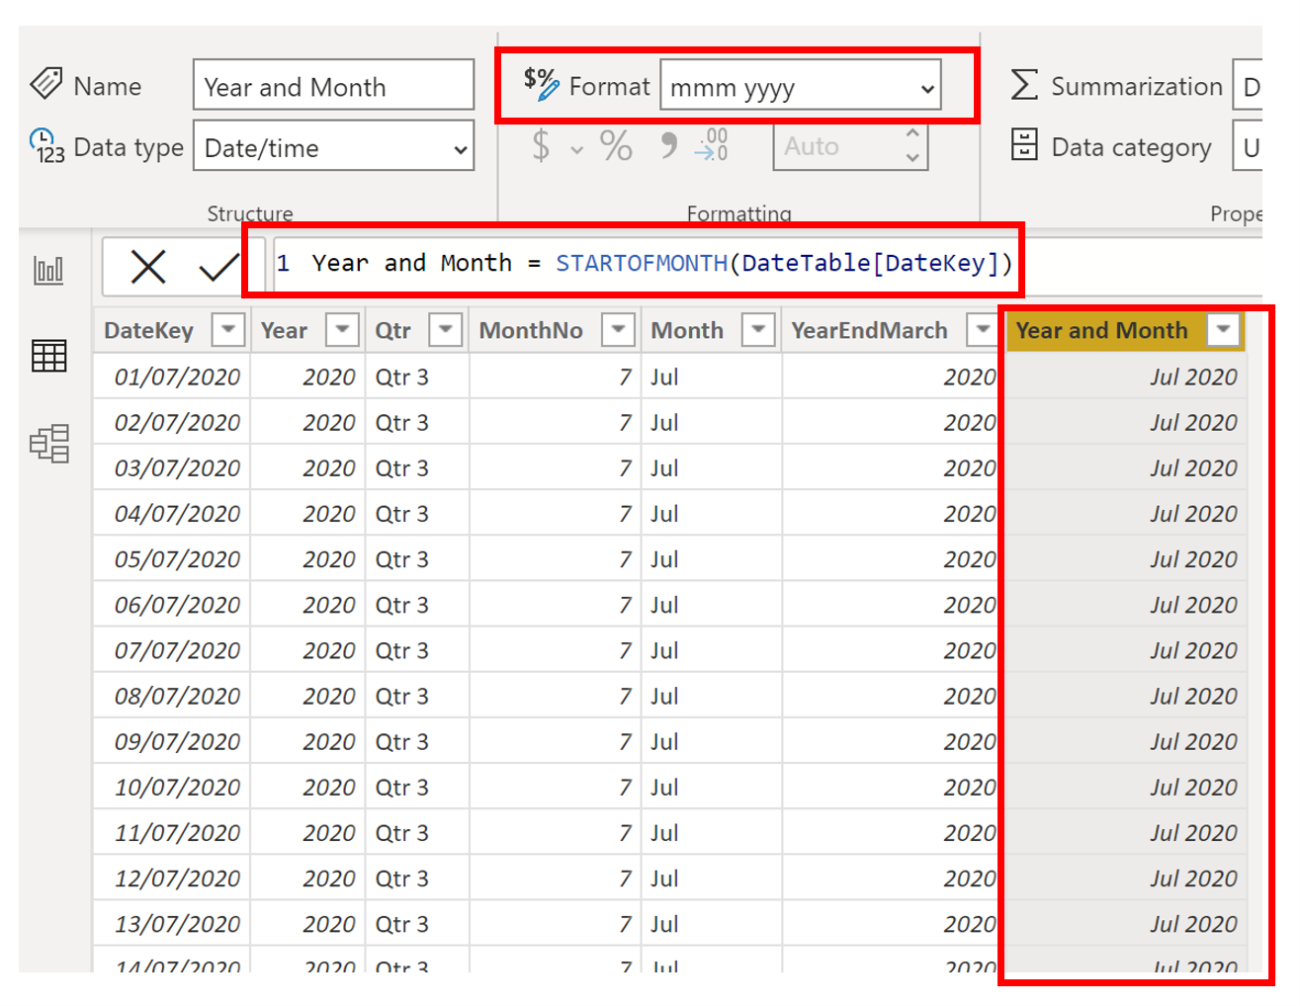
First, you will need to generate the values to display on the X-axis of the column chart that comprise the month and year labels. Create a calculated column in your date dimension and use a DAX expression similar to this:-
Year and Month = STARTOFMONTH ( DateTable[DateKey])
This will group your dates by the first of each month but you can use the Format box on the Column Tools tab to format the date as “mmm yyyy” as shown here:-
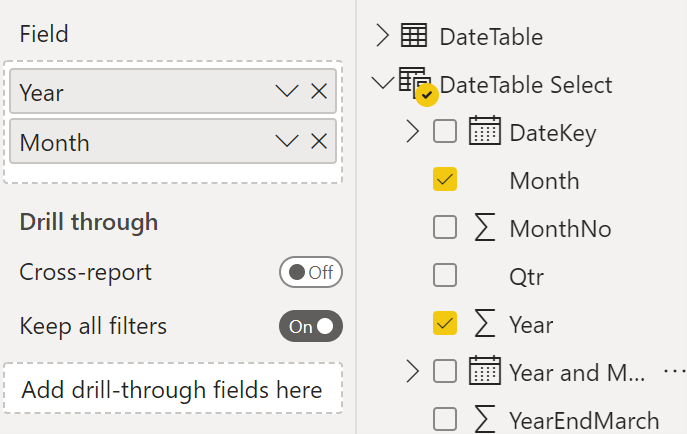
Now, make a copy of your date dimension. You can use Power Query or DAX to do this. I have called my copy “DateTable Select”. Don’t relate this table to any other tables in the Date Model as shown here:-
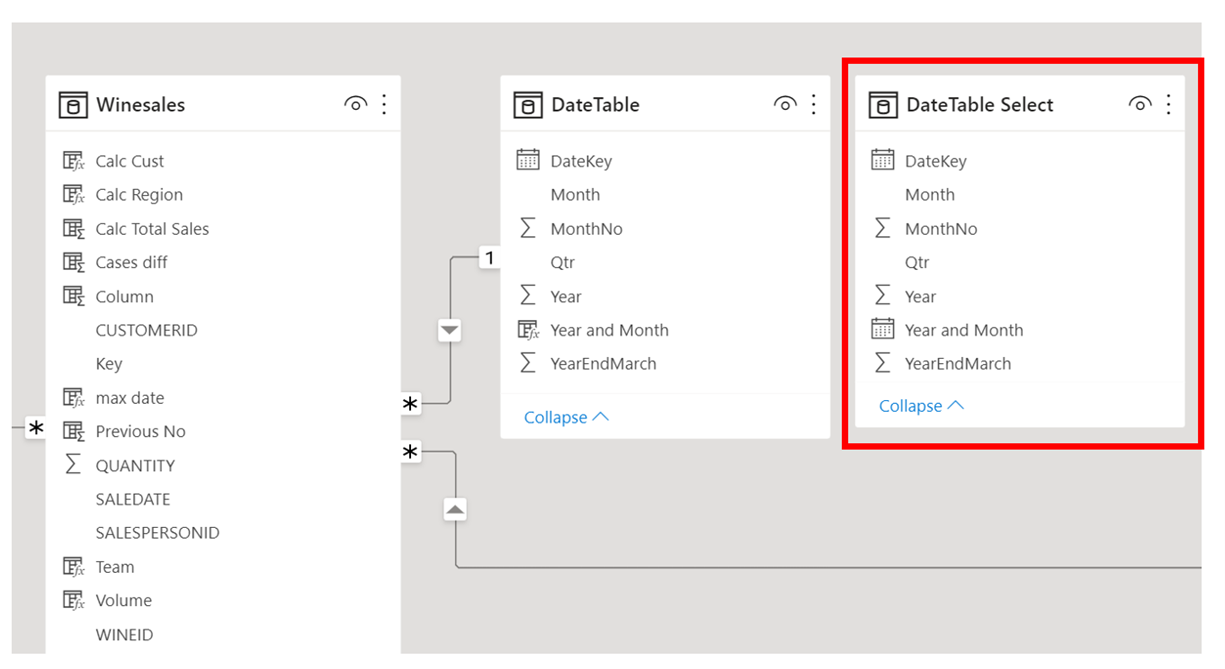
We will use the “Year” and “Month” columns from “DateTable Select” in the slicer to select the year and month from which we want to see the next or previous months. You can’t use the same columns from the DateTable in the slicer because it would always filter the column chart by the selected month. To see columns for multiple past or present months in the chart, we will use a measure to calculate values that will only show for the months to be considered.
Now you need to create two tables that will provide the values for slicers that will harvest the user choices of Next or Previous and how many months are required. Use the “Enter Data” option for this as shown below:
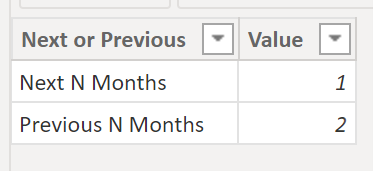
The “Select Next or Previous” table comprises two columns “Next or Previous” and “Value” as shown here:-
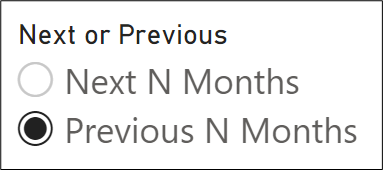
Now add this slicer to the canvas using the “Next or Previous” column:-
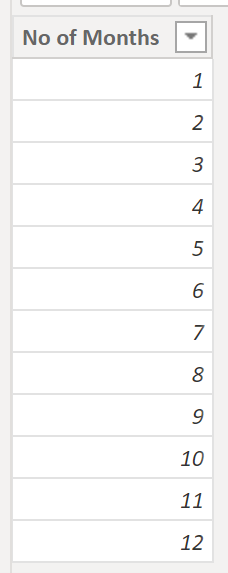
The “Select N Months” table contains a single column, “No of Months” which will be used in a slicer:-
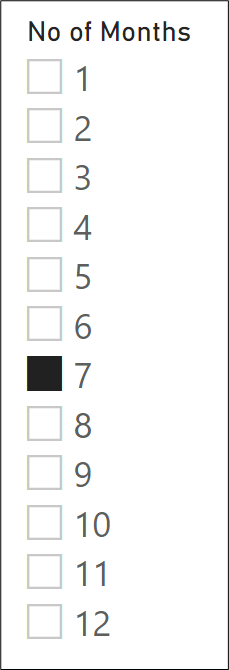
Add this slicer to the canvas:-
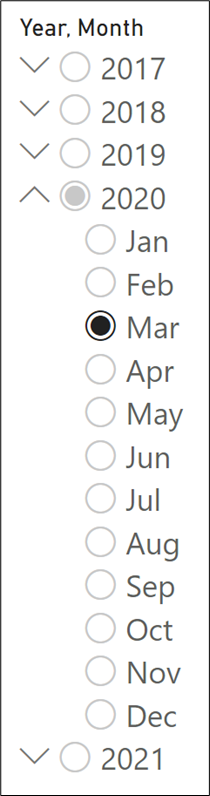
Now add the slicer for selecting the Year and Month from which to calculate the next or previous N months using the “Year” and “Month” fields from the “DateTable Select” table:-
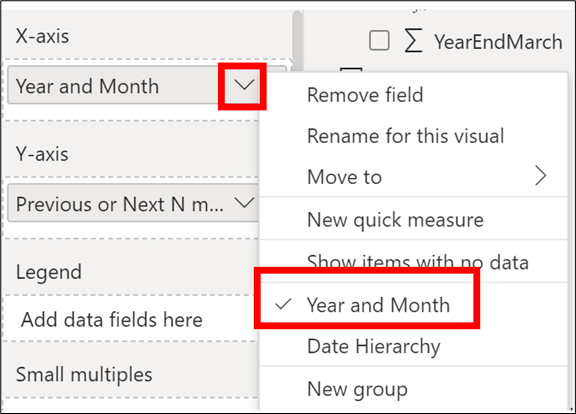
Now we can construct the column chart, using the “Year and Month” column from the DateTable on the X-axis. If the “Year and Month” column presents itself as a date hierarchy (which it probably will), remove this hierarchy by using the field’s dropdown in the X-axis bucket to select the column and not the hierarchy.
Now write this DAX measure to use on the Y-axis:-
Previous or Next N months =
VAR mypreviousdate =
FIRSTDATE (
DATEADD (
'DateTable Select'[DateKey],
SELECTEDVALUE ( 'Select N Mths'[No of Months] ) * -1,
MONTH
)
)
VAR mynextdate =
LASTDATE (
DATEADD (
'DateTable Select'[DateKey],
SELECTEDVALUE ( 'Select N Mths'[No of Months] ),
MONTH
)
)
VAR nextmths =
CALCULATE (
[Total Sales],
KEEPFILTERS ( DateTable ),
DateTable[DateKey] >= MIN ( 'DateTable Select'[DateKey] )
&& DateTable[DateKey] <= mynextdate
)
VAR prevmths =
CALCULATE (
[Total Sales],
KEEPFILTERS ( DateTable ),
DateTable[DateKey] >= mypreviousdate
&& DateTable[DateKey] <= MAX ( 'DateTable Select'[DateKey] )
)
RETURN
SWITCH (
SELECTEDVALUE ( 'Select Next or Previous'[Value] ),
1, nextmths,
2, prevmths
)
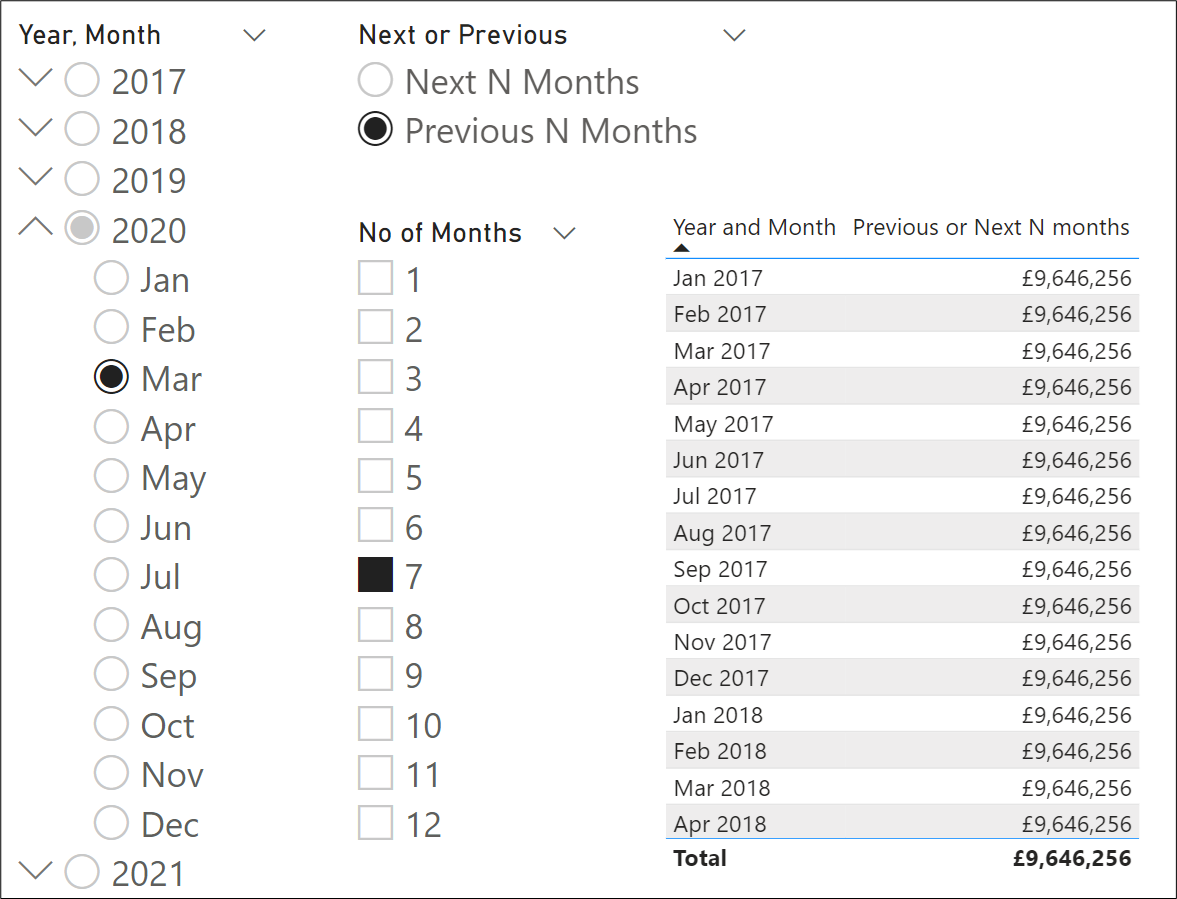
Note the use of the KEEPFILTERS function here. Without the use of KEEPFILTERS, the CALCULATE function will replace the filter on each month with the new filter generated by CALCULATE. Therefore, if we didn’t use this function, the measure will generate a total sales value for the date range defined by CALCULATE and display this against each month. For example, here we have the total sales value between March 2020 and the previous 7 months.
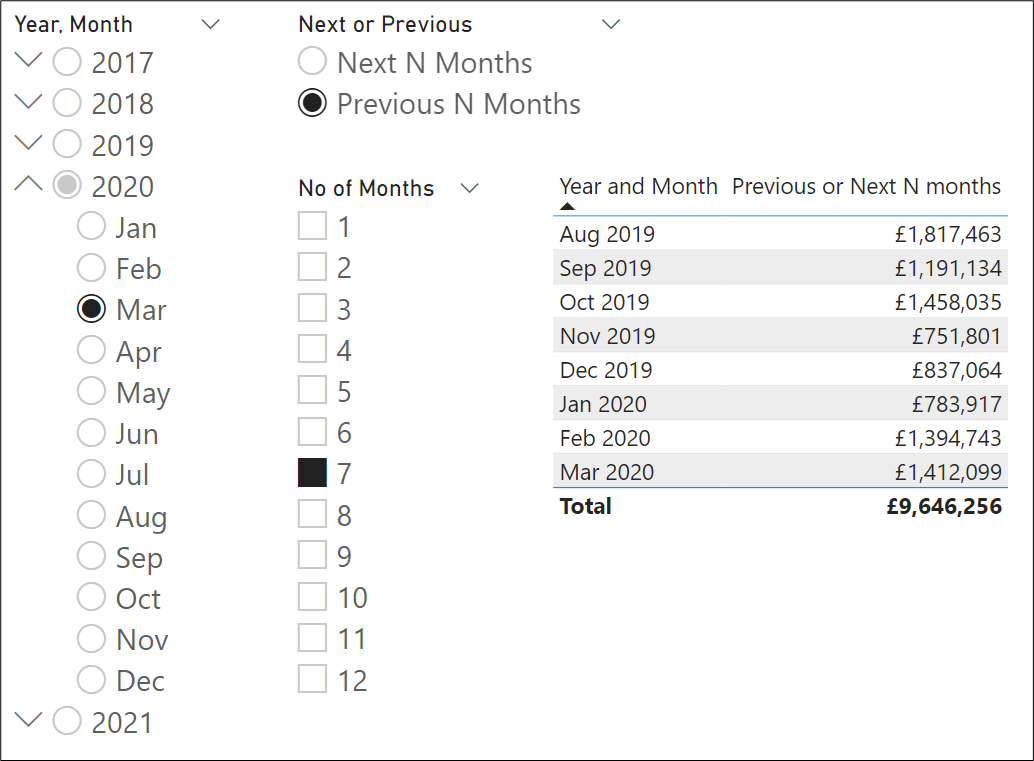
By using KEEPFILTERS, the filters are retained on each month and so the sales values can be calculated only for the months to be considered by the filter generated by CALCULATE:-
Therefore, it’s only by using a duplicate DateTable can we supply the date that CALCULATE uses to find the next and previous months' values. An alternative approach would be to use SUMX with FILTER to generate the "nextmths" and "prevmths" variables, but the use of two iterating functions makes this clumsier approach less desirable:-
VAR nextmths =
SUMX (
FILTER (
DateTable,
DateTable[DateKey] >= MIN ( 'DateTable Select'[DateKey] )
&& DateTable[DateKey] <= mynextdate
),
[Total Sales]
)
VAR prevmths =
SUMX (
FILTER (
DateTable,
DateTable[DateKey] >= mypreviousdate
&& DateTable[DateKey] <= MAX ( 'DateTable Select'[DateKey] )
),
[Total Sales]
)
Add new comment