Visualising Targets Dynamically Using a Constant Line
One of the questions that I’ve been asked consistently over the past five years is “can we have a dynamic constant line?”. The Constant Line they are referring to is the option that you can find on the magnifying glass, now labelled “Add further analyses to your data”.
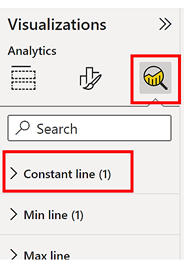
The answer was always no! That is until now. The great news is that now you can add constant lines that are no longer constant but change with user selections from slicers or from the Filters pane.
Let’s remind ourselves of what it was like before. Until recently, the constant analytical line was just that; a constant line that you could add to bar or column charts that plotted a static value. What’s more you had to enter the value manually. For example, you can see below that we are analysing our salespeople’s sales performance in each year and have added a Target value of 30,000 into the Value bucket of a Constant line. You can see this line plotted on the charts.
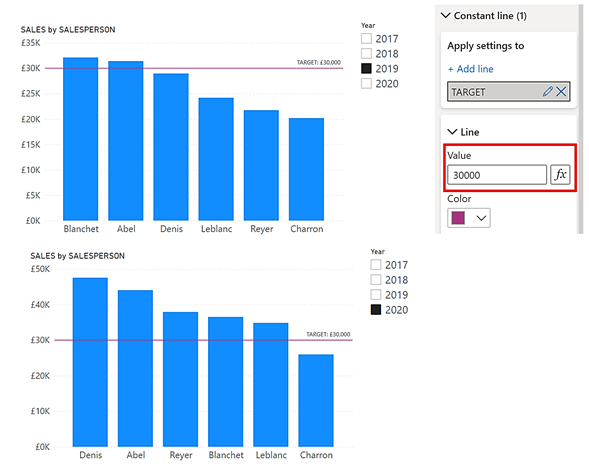
This would be fine if the Target was only ever 30,000 irrespective of the year selected in the slicer. However, this is particularly unrealistic. The chances are that you would have different targets for each year and have a table in your Data Model that recorded this data accordingly. I’ve called such a table “Yearly Targets”:-
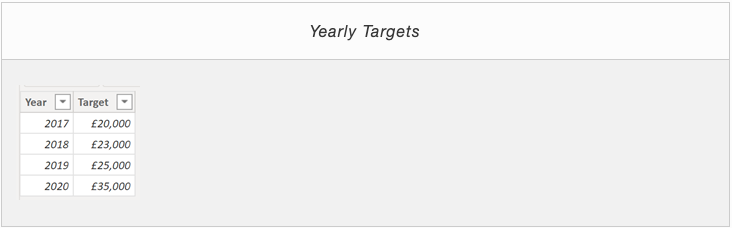
Please note that this table would not need to be related to any other tables in your Data Model.
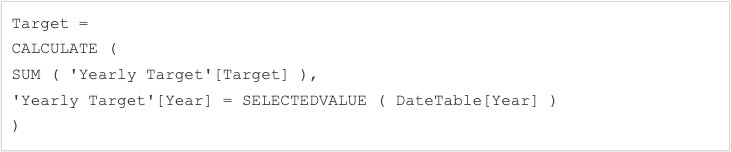
Ideally, you would then like to generate a dynamic line that shows these Targets according to the year selected in the slicer, as shown below where for 2019, the Target is £25,000 and for 2020 is £35,000:-
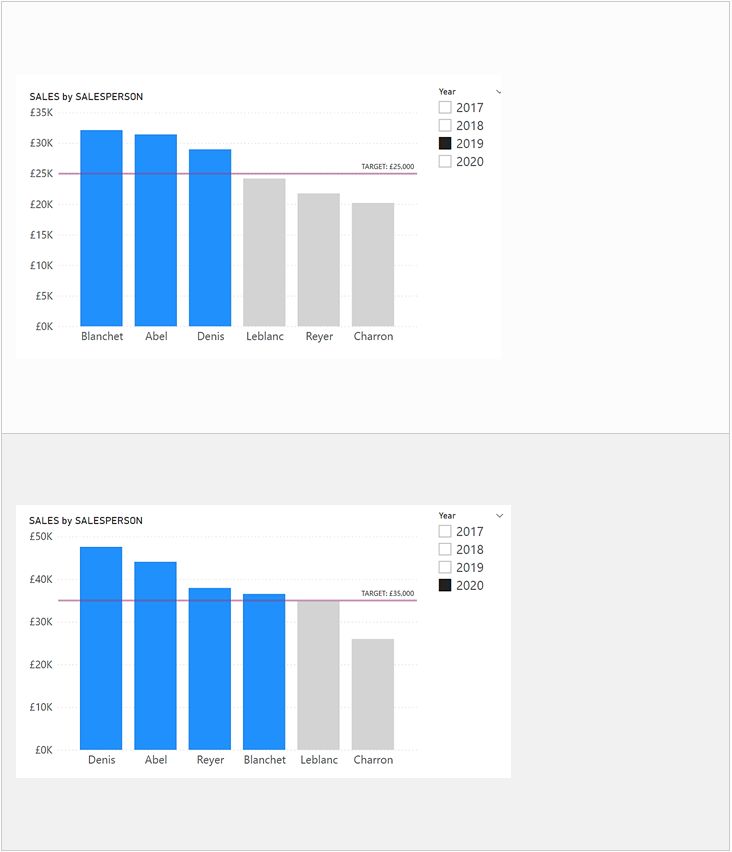
In the visuals above, I have also used conditional formatting on the columns to show the salespeople whose sales are below the target. These columns have been conditionally coloured light grey.
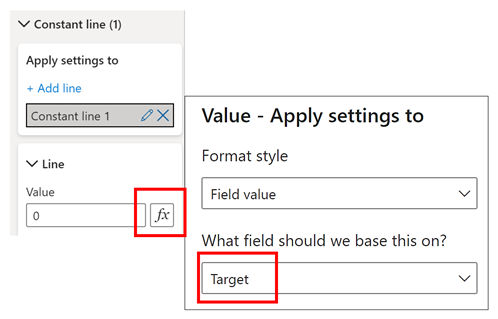
If you would like to generate similar visuals to those shown above using the dynamic Constant line and the conditional formatting for the columns, the starting point is to create a measure that can be used for the Constant line value. This line must respond to the filtering of the year in the slicer. Therefore, the measure must filter the relevant year in the “Yearly Targets” table according to the slicer selection:-
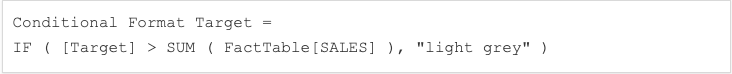
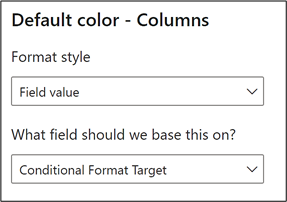
Now you can add this measure to the conditional formatting option of the Constant line. Click on the “f of x” button beside the Value bucket and in the conditional formatting dialog, select “Field value” as the Format style and then select your measure in “What field should we base this on” drop down as shown below.
To add the conditional formatting to the columns or bars of your chart, you will need another measure that assigns a color to the columns that will be below the target. For example:-
The you can use the “f of x” button beside the default color option of the chart and this time select this measure on which to base your Field value:-
So at long last, after 5 years, we have finally arrived at an analytical line that does what we want.
Add new comment