Why Do I Need a Date Table in My Data Model?

The following is an extract from Alison's book 'Up and Running with DAX for Power BI'
Have you ever wanted to compare sales for the current month against sales for last month? Or perhaps something a little more ambitious, such as cumulative totals or even a rolling monthly average? If the answer is yes, and why wouldn’t it be, calculations using date data such as these require the use of a group of DAX functions called “time intelligence” functions. Exploring these functions will be the focus of this chapter and you will learn how to design expressions to enable you to evaluate data across different granularities of time such as financial years, quarters, months and even down to the day grain. In doing so you will be able to compare and contrast calculations over those periods to build insights into the data that’s important to you, such as trends and patterns over time.
Note: The term “time intelligence” is a little misleading. These are not time intelligence functions but date intelligence functions so these functions will not help you with calculations on hours, minutes, or seconds, although we can do these calculations with the help of a Time dimension.
The starting point to using time intelligence functions is the creation of a date table, or more precisely a date dimension, as I prefer to call it. This is because most time intelligence functions are designed to work with a date table as an integral part of the data model. You may feel your data model doesn’t require a date dimension, but you’ll struggle to create the date-based calculations you need, and you certainly won’t be able to reap the benefits of time intelligence measures.
However, people new to DAX often don’t appreciate this aspect of date calculations and therefore don’t have a date dimension in their model. If this is the case, Power BI will help you with your date analysis by generating built-in date hierarchies and this is what we will explore first.
Power BI Date Hierarchies
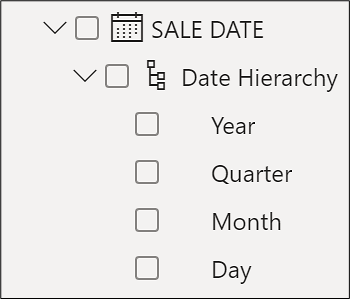
In the absence of a date dimension in your model, if you have columns of a date data type in any tables, for every one of these columns Power BI will generate an in-memory date table for you that also contains a date hierarchy. We have removed the DateTable dimension from our data model and so the SALE DATE column is now expressed as a date hierarchy as shown:
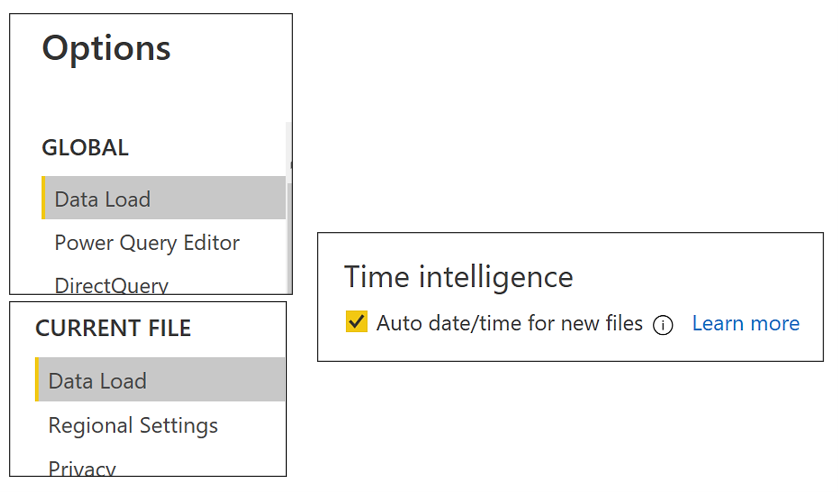
This feature is called “Auto date/time” but you can turn off this behaviour either globally or only for the current file in the Options pane:
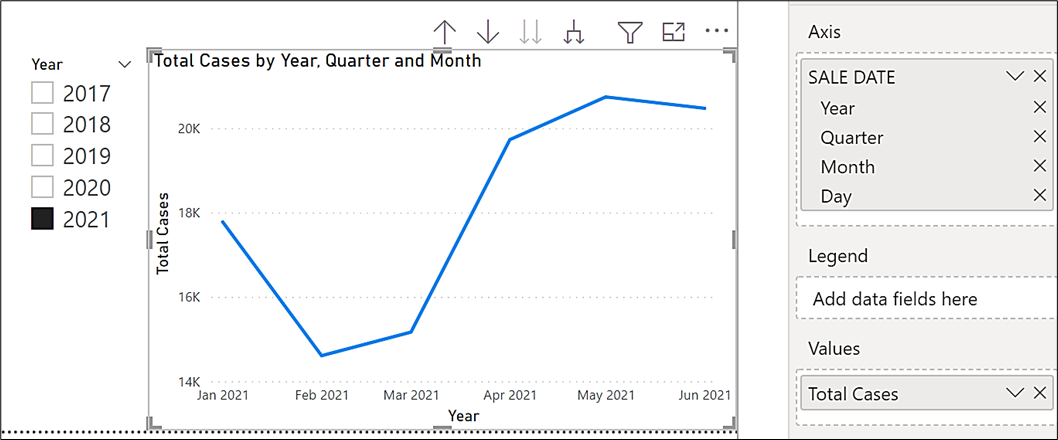
If you have the “Auto date/time” feature turned on and you don’t have a date dimension in your model, any fields of a date data type will be structured into hierarchies. These built-in date hierarchies are useful for drilling into different date granularities when put into Power BI visuals and also make it possible to slice by year, quarter, month and day. For example, here we are using the SALE DATE hierarchy to drill into Month granularity in a Power BI line chart and slice by year:
However, there are several drawbacks to using these hierarchies:-
- What if your financial year doesn’t start in January?
- What if you want to analyze sales by week granularity? How would you add week numbers?
- What if you want to compare sales in 2020 with sales in 2021 in a clustered column chart?
All the problems above present a real challenge if you’re using built-in date hierarchies, but if you have a date table dimension in your model, life becomes a lot easier as far as date calculations go. In fact, I would say that to resolve most date analysis scenarios, the existence of a date table is mandatory. Therefore, the first step is generating your date dimension table and integrating it into your data model.
Creating a Date Table
To generate your date table, you can use DAX or Power Query as explained comprehensively in these two links:-
https://www.sqlbi.com/articles/creating-a-simple-date-table-in-dax/
https://exceleratorbi.com.au/build-reusable-calendar-table-power-query/
Failing these two suggestions you could use Excel to create a date table.
The only mandatory column in a date table is a column containing a list of sequential dates that includes all the dates that cover the time span of your data. For example, our wine sales begin in January 2017 and end in December 2021, therefore our date table has a DATEKEY column with values starting on 1st January 2017 and ending on 31st December 2021 (the end of our financial year). You must include all the dates in these years even if there is no data for specific dates. The other columns in the date table are used to group and categorize these dates and are completely arbitrary. However, it would be normal to have columns for your financial year and quarters and columns for months, including month name and month number. You could also include different financial years and week numbers. To analyze by months, you need to include both month name and month number. This is so you can sort the month names correctly and some measures will require referencing both month name and number.
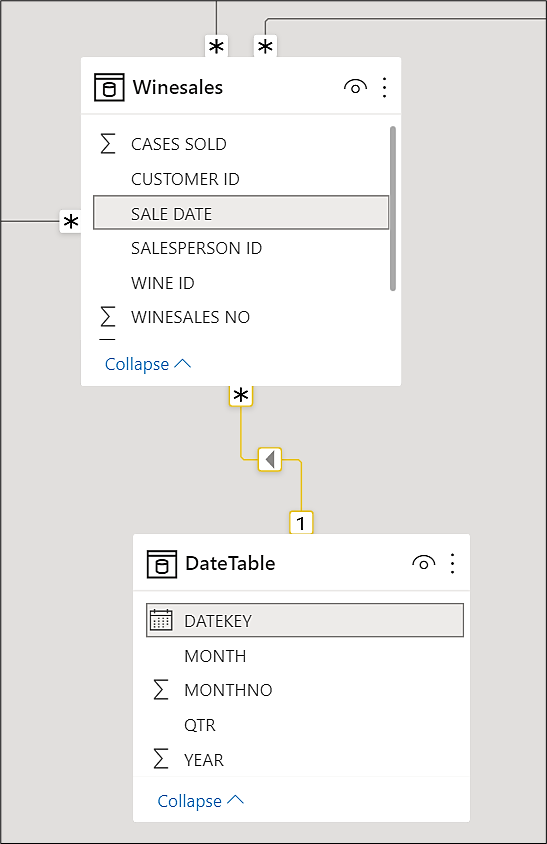
We’ve now replaced our DateTable back into our data model. You can see the DateTable is related to the fact table using the SALE DATE and the DATEKEY columns as shown:
Note: It’s usual to use the column in your Date table that contains the list of unique dates as the linking field or primary key, but it would be possible to use some other unique field in the Date table as the linking field. However, you must always have a column containing a list of sequential dates in your Date table even if you don’t use this field to link to the fact table.
The next requirement regarding the date table is to ensure the model “knows” this is your date dimension. This is particularly true if you haven’t used the field containing the list of unique dates as the primary key of the date table. You do this by marking the date dimension as a date table by selecting Mark as date table from the Table Tools tab. Now, in the “Date column” drop-down, select the column in your date table that contains the list of unique dates.
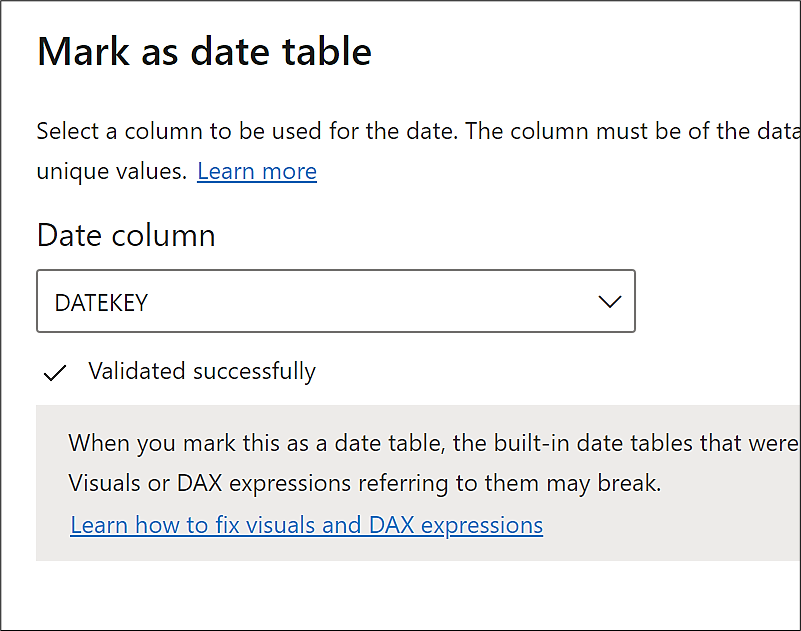
Note: You will find more information on the requirement to “Mark as date table” here https://www.sqlbi.com/articles/mark-as-date-table/
The final step in the setup of the data dimension is to sort the month names correctly. You can see that we’ve used the Sort by column button on the Column Tools tab to sort the Month by the Month No.
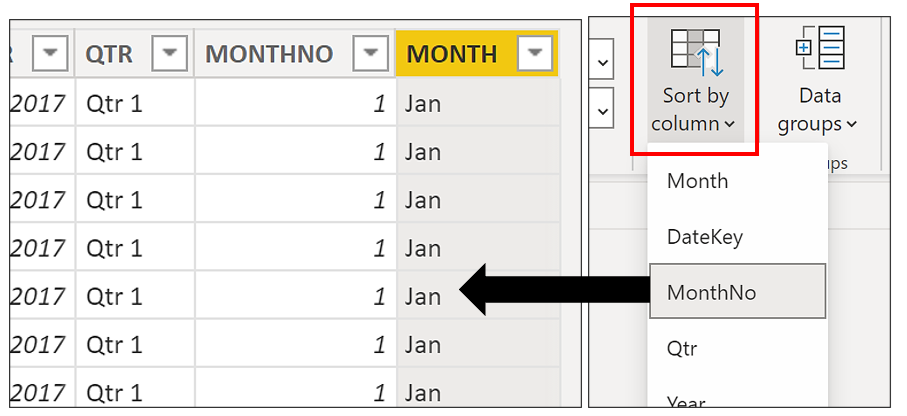
Figure 9-6. Use the Sort by column option to sort the month names
Now we have generated our date dimension we can reap the benefits of using the time intelligence functions inside DAX and analyze our data across years, quarters, months, and days in many insightful ways.
Add new comment