 “Strictly Come Dancing” Power BI analysis13th December 2021Yes, “Strictly Come Dancing” is with us yet again for the 21st Series! And yes, we’re crunching the numbers again not only on this series' contestants but also on the previous 20 series and the 294 other competitors who have danced over 2,000 dances...
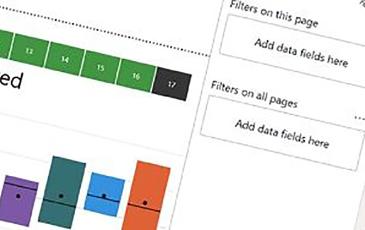 Context Transition: Where the Row Context Becomes a Filter Context24th August 2021“Nothing in life that’s worth anything is easy.” Barack Obama. And we could also say that nothing in DAX that’s worth anything is easy! Certainly the...
 Charticulator in Power BI #728th June 2021Using Two Categorical Axes. In my very first post on Charticulator, I urged you to forget everything you currently know about creating conventional...
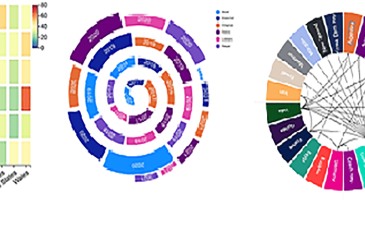 Charticulator in Power BI #624th June 20212D Region Plot Segments Part 2 – Sorting, Spacing, Aligning etc. In my last blog post, we delved into the mind-bending world of plot segment sub...
 Getting formatted text into your Power BI reports24th June 2021Hi I’m Alan , a new name here at Burningsuit and this is the first of what I hope will be many Blog posts from me. Recently I was talking with a...
 Charticulator in Power BI #521st June 20212D Region Plot Segments Part 1 – Sub-Layouts. In my last post I showed you how to create a line chart using a symbol as your glyph. You also learned...
 Charticulator in Power BI #4.18th June 2021Using Symbols & Y-Axis Weirdness. If you’ve been following along with my earlier posts on Charticulator , it may not have escaped your notice that I...
Blog
As Microsoft software evolves and new opportunities to enhance your data visualisation and integration evolve through Power BI, we like to keep you up to date. Our blog not only looks at new developments but shares consultancy news and training opportunities. Sign up to our blog to stay in touch.
