How to Use Power BI Bookmarks & New Features

Recently, a range of new features have been added to Power BI. From a user point of view, some of the most interesting are bookmarks, selections, links and hidden pages. These give much greater control over how users can interact with reports.
Burningsuit Ltd Managing Director Stuart Box has created a guide and example uses for each feature to help you get to grips with what is possible:
Activate Bookmarks
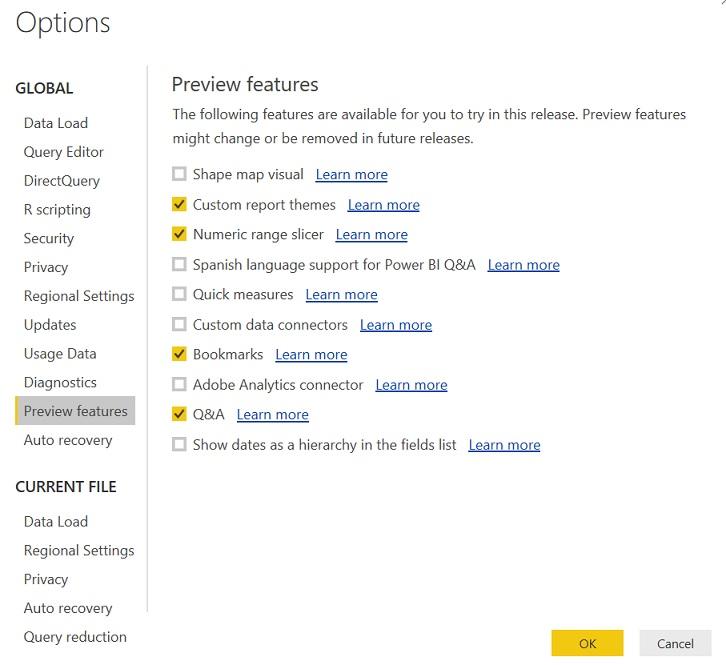
Currently (February 2018) Bookmarks are still in Preview in Power BI, so the first thing we’ll have to do is turn them on. Head over to File/Options and Settings/Options in the Power BI Desktop, and there you’ll see the preview features.
Enable “Bookmarks” here, and anything else you might find interesting. Bear in mind these might be subject to change in future releases, but it’s good to get a preview of new features, and I don’t think Bookmarks are going to change drastically.
Once you’ve set the preview features you’ll need to restart Power BI Desktop, then you’ll have a new “Bookmarks Pane” tick box on the view menu.
Adding Bookmarks
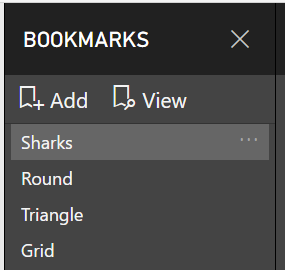
Once you have some visualisations on your report, turn on the Bookmarks pane on the view menu. From here you can add a bookmark. As the name suggests bookmarks remember a location in your report, together with the sort order and any filters that have been applied. To create a bookmark click “add Bookmark” in the bookmarks pane. The bookmark will be created with a generic name, but you can change this to something more meaningful, just click on the three dots next to the bookmark and select “rename”.
Navigating Bookmarks
Once you have a few bookmarks created you can use the bookmarks pane to navigate between them simply by clicking on them, or by clicking on the view icon to get a navigation bar at the bottom of the screen. This view steps forward or backwards through the bookmark list. Used like this, Bookmarks can help you “tell the story” of your data and help with presentation.
Selection Pane
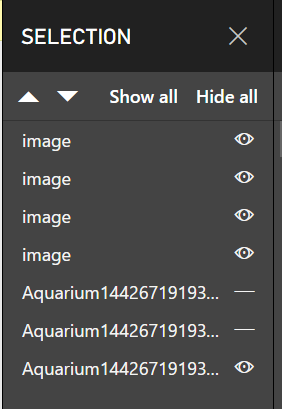
Now we have some bookmarks we can turn on the Selection Pane in the view menu. This shows for each bookmark, which visualisations are shown on the canvas.
For each bookmark, you get a list of the visualisations on that bookmark. You can then hide or reveal those visualisations by clicking on the “eye” next to each item; it’s a bit like layers in Photoshop.
Toggling the eye on and off hides or unhides the associated visual. Once you have made changes to the selection pane you can update the bookmark by clicking on the three dots next to the bookmark name and selecting “Update”.
The selection pane can be used to select several differing visualisations, showing differing views per bookmark.
Link Images
With bookmarks and selections in place we can manage the whole thing with “Image Links”.
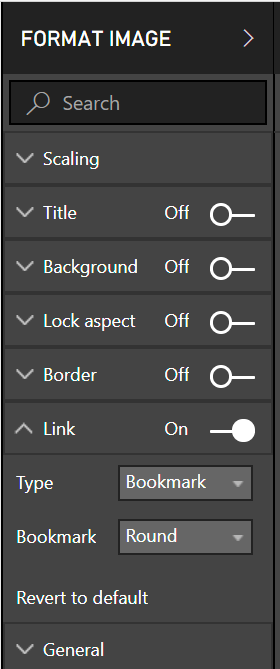
Firstly, we need to place an image on the canvas. It’s worth getting a library of useful images for these things. When you’ve located a suitable image, put it on the report canvas. Now on the “Format Image” pane on the right you’ll see the option to “Link” the image, turn this on, and select a link type.
“Bookmark” links the image to a bookmark, whereas “Back” makes the image act like a “Back Button” returning back to a previous page. Select the “Bookmark” and enter the bookmark name you want to go to on the image.
Now, when you “Control and Click” on the image, it’ll take you to the bookmark. You can put several images on a page and link them to bookmarks like a menu. Then each page you land on can have a “back” image that takes you back to the menu!
Finally, Publish
The last step is to publish your report to Power BI. Now you can view the report by simply clicking on the images, which takes you to the bookmark. For this you only need “Control and Click” in the desktop editor.
Of course, if you share this report, users can also click on the images to drive the report. This means you can produce a very intuitive report where users can just click on items to get what they want.
Examples
Here’s a link to an example report I’ve created to show what’s possible using the Bookmark feature.
This uses the Aquarium custom visual, and you can click on the fish type to change its look:
If you want to download the Power BI Desktop file that created this report you can find it here:
If you are interested in learning more about Power BI, please view our training courses or give us a call on 0800 0199 746.
– Stuart
Add new comment