The 8th Secret of the Matrix Visual: Controlling Calculations and Labels on Subtotals

Since I wrote my blog on The 7 Secrets of the Matrix Visual in April 2019, the world has changed (in so many ways) and things have moved on with the Matrix Visual. With this in mind, I thought it was time for an update to that article. I’ve been wanting to do this for some time because I know from the popularity of my blog that lots of you are particularly excited by the Matrix (the visual that is, not the superlative film starring Keanu Reeves).
Clearly, the only way I can possibly improve on the “7 Secrets” blog is now for me to reveal Secret No.8. This is a particularly little known secret; how to control the Subtotals of the Matrix, both with regard to calculations and labels. I know that at this point you’re thinking is this a secret that needs revealing. Why would you need to control the Subtotals of the Matrix?
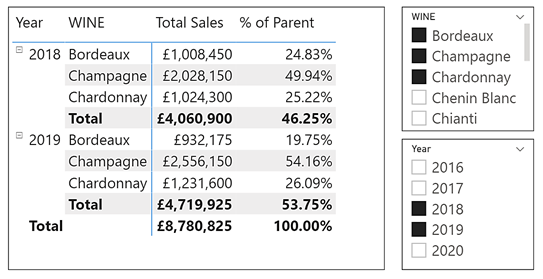
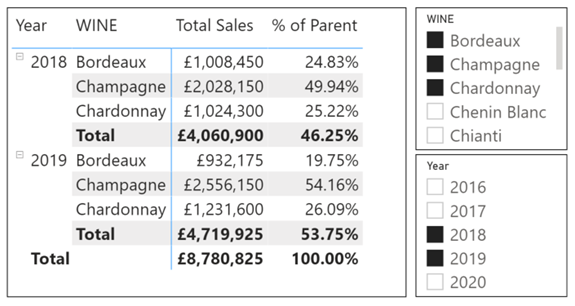
To answer this question, let’s look at the percentages in the “% of Parent” measure in the Matrix below:-
We understand these percentages because if this same data were in an Excel Pivot Table, we would get the same numbers by using the show values as “% of Parent Row Total”, as shown below:-
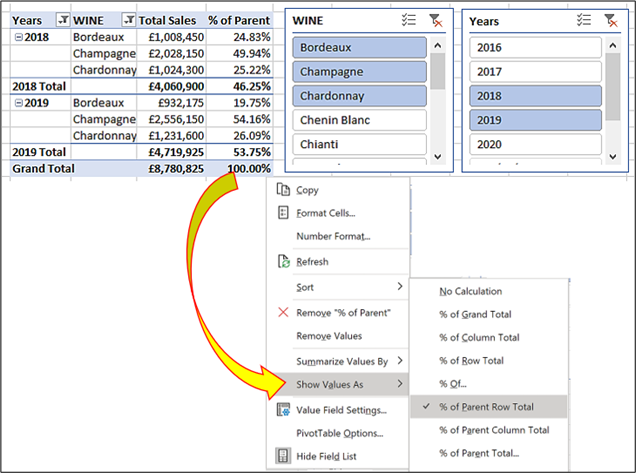
You will see that in the Matrix visual and in the Pivot Table the wines and years have been filtered by slicers and show sales for three different wines in the years 2018 and 2019. The “% of Parent” column in the Matrix and Pivot Table is showing two different percentages as follows:-
- For each wine, it shows what the percentage that wine’s sales are of the total for that year for all the
selected wines (e.g. In 2018, “Bordeaux” sales are 24.83% of the total sales for “Bordeaux”, “Champagne” and “Chardonnay”). - On the subtotals for each year however, it shows what the percentage that year’s sales are of the total for all the selected
years.
As you can see, these percentages are pretty easy to do in Excel but unfortunately, in the Matrix visual, we can’t just “show values as percent of parent row total”. We need to do the calculation ourselves using a DAX measure. So how did I calculate the “% of Parent” measure in the Matrix visual above?
The starting point is to calculate the two different denominators that are required to divide into the Total Sales. For each wine’s sales it’s the value in the subtotal (i.e. for 2018 it’s £4,060.900 and for 2019 it’s £4,719,925), and for the subtotal for each year it’s the grand total of £8,780,825.
To calculate the two different denominators, I’ve used these two DAX measures:-
All Wine =
CALCULATE ( [Total Sales], ALLSELECTED(Wines[WINE] ) )
All Years =
CALCULATE ( [Total Sales], ALLSELECTED(DateTable[Year] ) )
And then used them to divide into the “Total Sales” measure:-
Sales Divided by ALL Wine =
Divide ( [Total Sales],[All Wine] )
Sales Divided by ALL Years =
Divide ( [Total Sales],[All Years] )
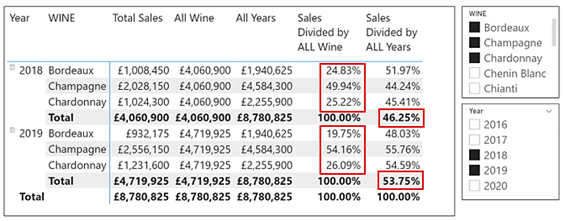
However, you can see the problem with both these measures. In the example below, we’ve highlighted where these calculations return the correct result. “Sales Divided by ALL Wine” gives us the correct calculation for each wine but not for the subtotal for the year. “Sales Divided by ALL Year” gives us the correct calculation for the yearly subtotals but not for each wine.
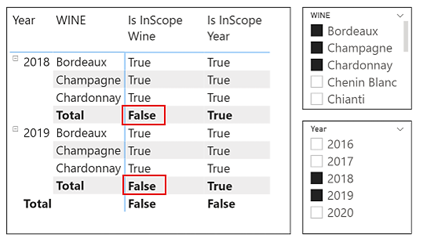
What we need to remedy this problem is a way to distinguish the different levels in the hierarchy so we can perform the correct division at the right level, either the YEAR level to divide by “All Years” or the WINE level to divide by “All Wines”. To do this, we can use the DAX function ISINSCOPE which returns TRUE when the column you specify is at that level in the Matrix hierarchy, as shown here:-
Is InScope Wine =
ISINSCOPE(Wines[WINE])
Is InScope Year =
ISINSCOPE(DateTable[Year])
Note: We can’t use the ISFILTERED function here because the expression “=ISFILTERED ( Wines[WINE] )” will always return TRUE because WINE is always being filtered by the slicer.
Notice how the WINE column is not in scope when the subtotal for the selected year is calculated because this calculation is at the YEAR level. So now we can use a simple IF expression to ensure that we divide by the “All Wine” measure only if the WINE level in the hierarchy has been reached.
% of Parent =
IF (
ISINSCOPE ( Wines[WINE] ),
DIVIDE ( [Total Sales], [All Wine] ),
DIVIDE ( [Total Sales], [All Years] )
)
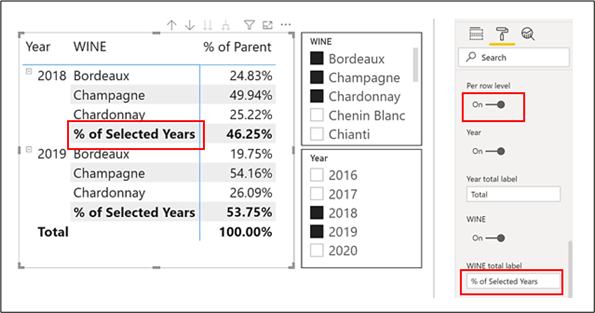
As a final embellishment, you may want to label the subtotals something other than “Total”. If you want different labels for your subtotals use the Subtotal card on the paint roller and turn on the “Per row level” slider. You will then get the opportunity to give each subtotal level a different label, as shown below:-
I hope you like Secret No.8 and will find this a useful addition to your knowledge of the Matrix Visual. I’m sure that in the not too distant future there will be a Matrix Secret No.9 that needs revealing, so watch this space!
We cover a range of DAX calculations on both our Fundamentals and Advanced courses, meaning you can get in depth knowledge on exactly how to use these functions to your advantage. If you would like more information about our courses, get in touch with our team on 0800 0199 746.
Add new comment