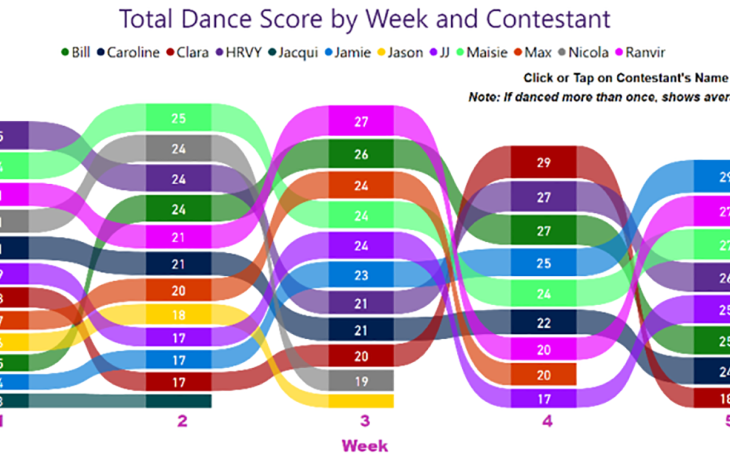
 “Strictly Come Dancing” Telling the Story Behind the Numbers with Power BI26th November 2020Back in March this year, I did think I’d be relieved of my duty of updating the Strictly Come Dancing Power BI Report to reflect another series. To be quite honest, I was hoping this would be the case. I first created the Report for Series 16...
 How DAX Treats Nulls & Zeros12th November 2020In DAX there is a special way to identify null or empty values and that’s by using a value called “blank”. In order to return blank values, we can use...
 The 8th Secret of the Matrix Visual: Controlling Calculations and Labels on Subtotals26th October 2020Since I wrote my blog on The 7 Secrets of the Matrix Visual in April 2019, the world has changed (in so many ways) and things have moved on with the...
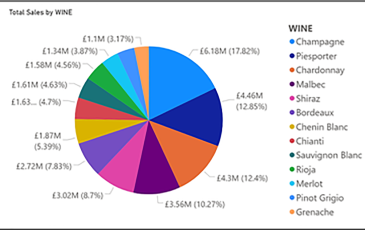 7 Secrets of the Pie Chart21st July 2020I suppose I shouldn’t really be writing this blog because the question has to be asked, why are you using a pie chart? But if you really must, at the...
 Sentiment Analysis in Power BI, analyse text reviews and a Premium tip.14th July 2020Power BI is great at analysing numeric data. Numbers like values, costs, stock holdings and averages can all be worked up into informative charts and...
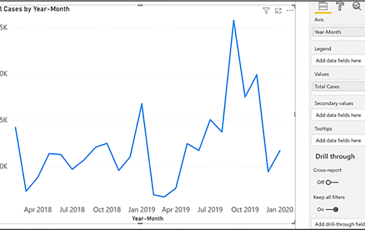 7 Secrets of the Line Chart10th July 2020The line chart is the go-to chart type to visualise data over time. Typically, this visual is used to analyse your data by year, quarter, month or by...
 The Benefits of Online Training for Businesses22nd June 2020Offering your staff training courses to improve their skills can be extremely beneficial to your business; not only will it allow you to improve your...
Blog
As Microsoft software evolves and new opportunities to enhance your data visualisation and integration evolve through Power BI, we like to keep you up to date. Our blog not only looks at new developments but shares consultancy news and training opportunities. Sign up to our blog to stay in touch.
