 Understanding the “Analytics” Lines in Power BI22nd June 2019In our Power BI training courses, I show people how to add a Constant Line to a clustered column chart by using the Analytics section of the Visualizations pane. I then explain that the other Analytical lines (Max, Min, Average etc) are “calculations...
 Burningsuit Featured at the Microsoft Business Applications Summit17th June 2019This week, the Burningsuit team were delighted to attend the Microsoft Business Applications Summit which took place in Atlanta, Georgia. The summit...
 Joke’s Over – send Email to users when refresh fails12th June 2019I do a lot of Power BI Training , and have been doing it since Power BI came out over three years ago. So to keep myself fresh, amuse myself and...
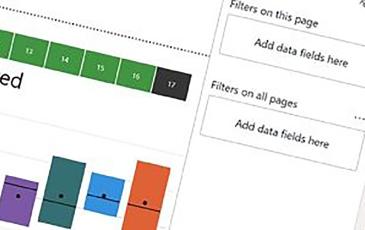 Best and Worst: Two approaches to finding Top or Bottom N Percent using DAX19th May 2019Ever wanted to find which are your best or worst customers or best or worst products by a metric such as Total Sales? Finding a simple TopN or BottomN...
 7 Secrets of the Matrix Visual 20199th April 2019Some of you Excel users may have realised that the Power BI Matrix visual is just an Excel Pivot Table by another term. You even get buckets for “Rows...
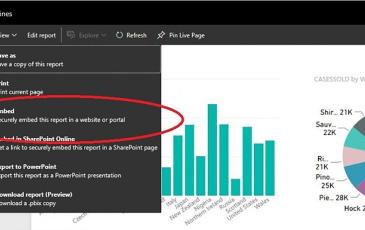 New Power BI feature, embed reports securely in Web Pages4th February 2019We know that we’ve been able to publish Power BI reports to the web for some time. It’s a good feature, allowing us to publish our “Strictly Come...
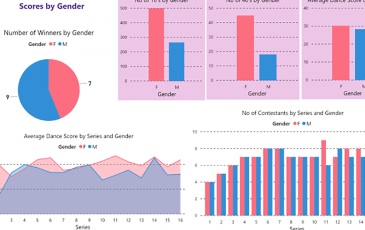 The “Strictly” Report: Insights into the Data29th January 2019Alison Box, one of our Directors and Trainers, details how she used Power BI to bring her Strictly statistics to life. In my previous blog, “ The...
Blog
As Microsoft software evolves and new opportunities to enhance your data visualisation and integration evolve through Power BI, we like to keep you up to date. Our blog not only looks at new developments but shares consultancy news and training opportunities. Sign up to our blog to stay in touch.
