 When Single Directional Filtering Appears Not to Work21st October 2022One of the major factors that underpins a good Power BI data model is when filters only propagate from the one side of a relationship to the many, that is from dimension tables to the fact table. This is known as single-directional filtering. However...
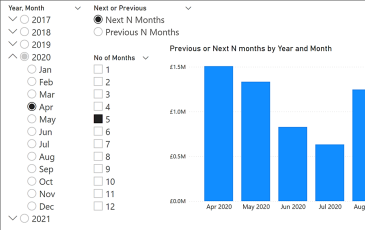 Visualising the Next or Previous N Months from a Selected Month11th October 2022Ever wanted to do this? S elect a month in a slicer and then visualise in a column chart the next 5 months’ sales from that date. Or show the previous...
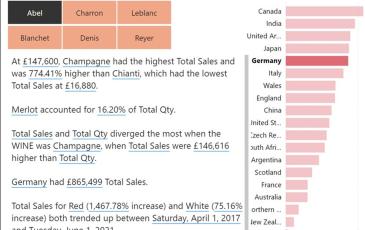 Using Dynamic Values in the Smart Narrative and Text Box3rd October 2022When you want to summarise key metrics in your report, the go-to visual you will probably use is the ubiquitous card visual. However, if you knew how...
 7 Secrets of the Matrix Visual2nd August 2022Following the success of our Seven Secrets of the Matrix Visual blog post way back in 2019 , we've decided to revisit this topic and update our seven...
 Burningsuit launches new website for Microsoft services28th June 2022We enjoy very productive relationships, helping individuals and organisations to get the very best out of using Power BI and other Microsoft products.
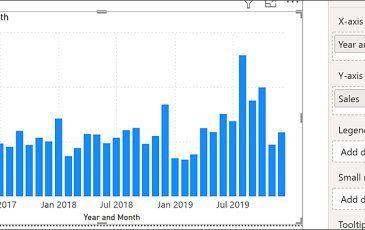 Using a Continuous X-Axis on Column Charts for Year and Month Labels28th April 2022Ever wanted to do this on the x-axis of a Column chart… …that is use a continuous x-axis for Month and Year labels? A continuous x-axis is used for...
 Visualising Targets Dynamically Using a Constant Line28th February 2022One of the questions that I’ve been asked consistently over the past five years is “can we have a dynamic constant line?”. The Constant Line they are...
Blog
As Microsoft software evolves and new opportunities to enhance your data visualisation and integration evolve through Power BI, we like to keep you up to date. Our blog not only looks at new developments but shares consultancy news and training opportunities. Sign up to our blog to stay in touch.
